NLRB Stats Archive › Annual Reports › FY1951 › Industrial distribution of collective bargaining elections, winner, eligible voters, and valid votes cast, during fiscal year 1951
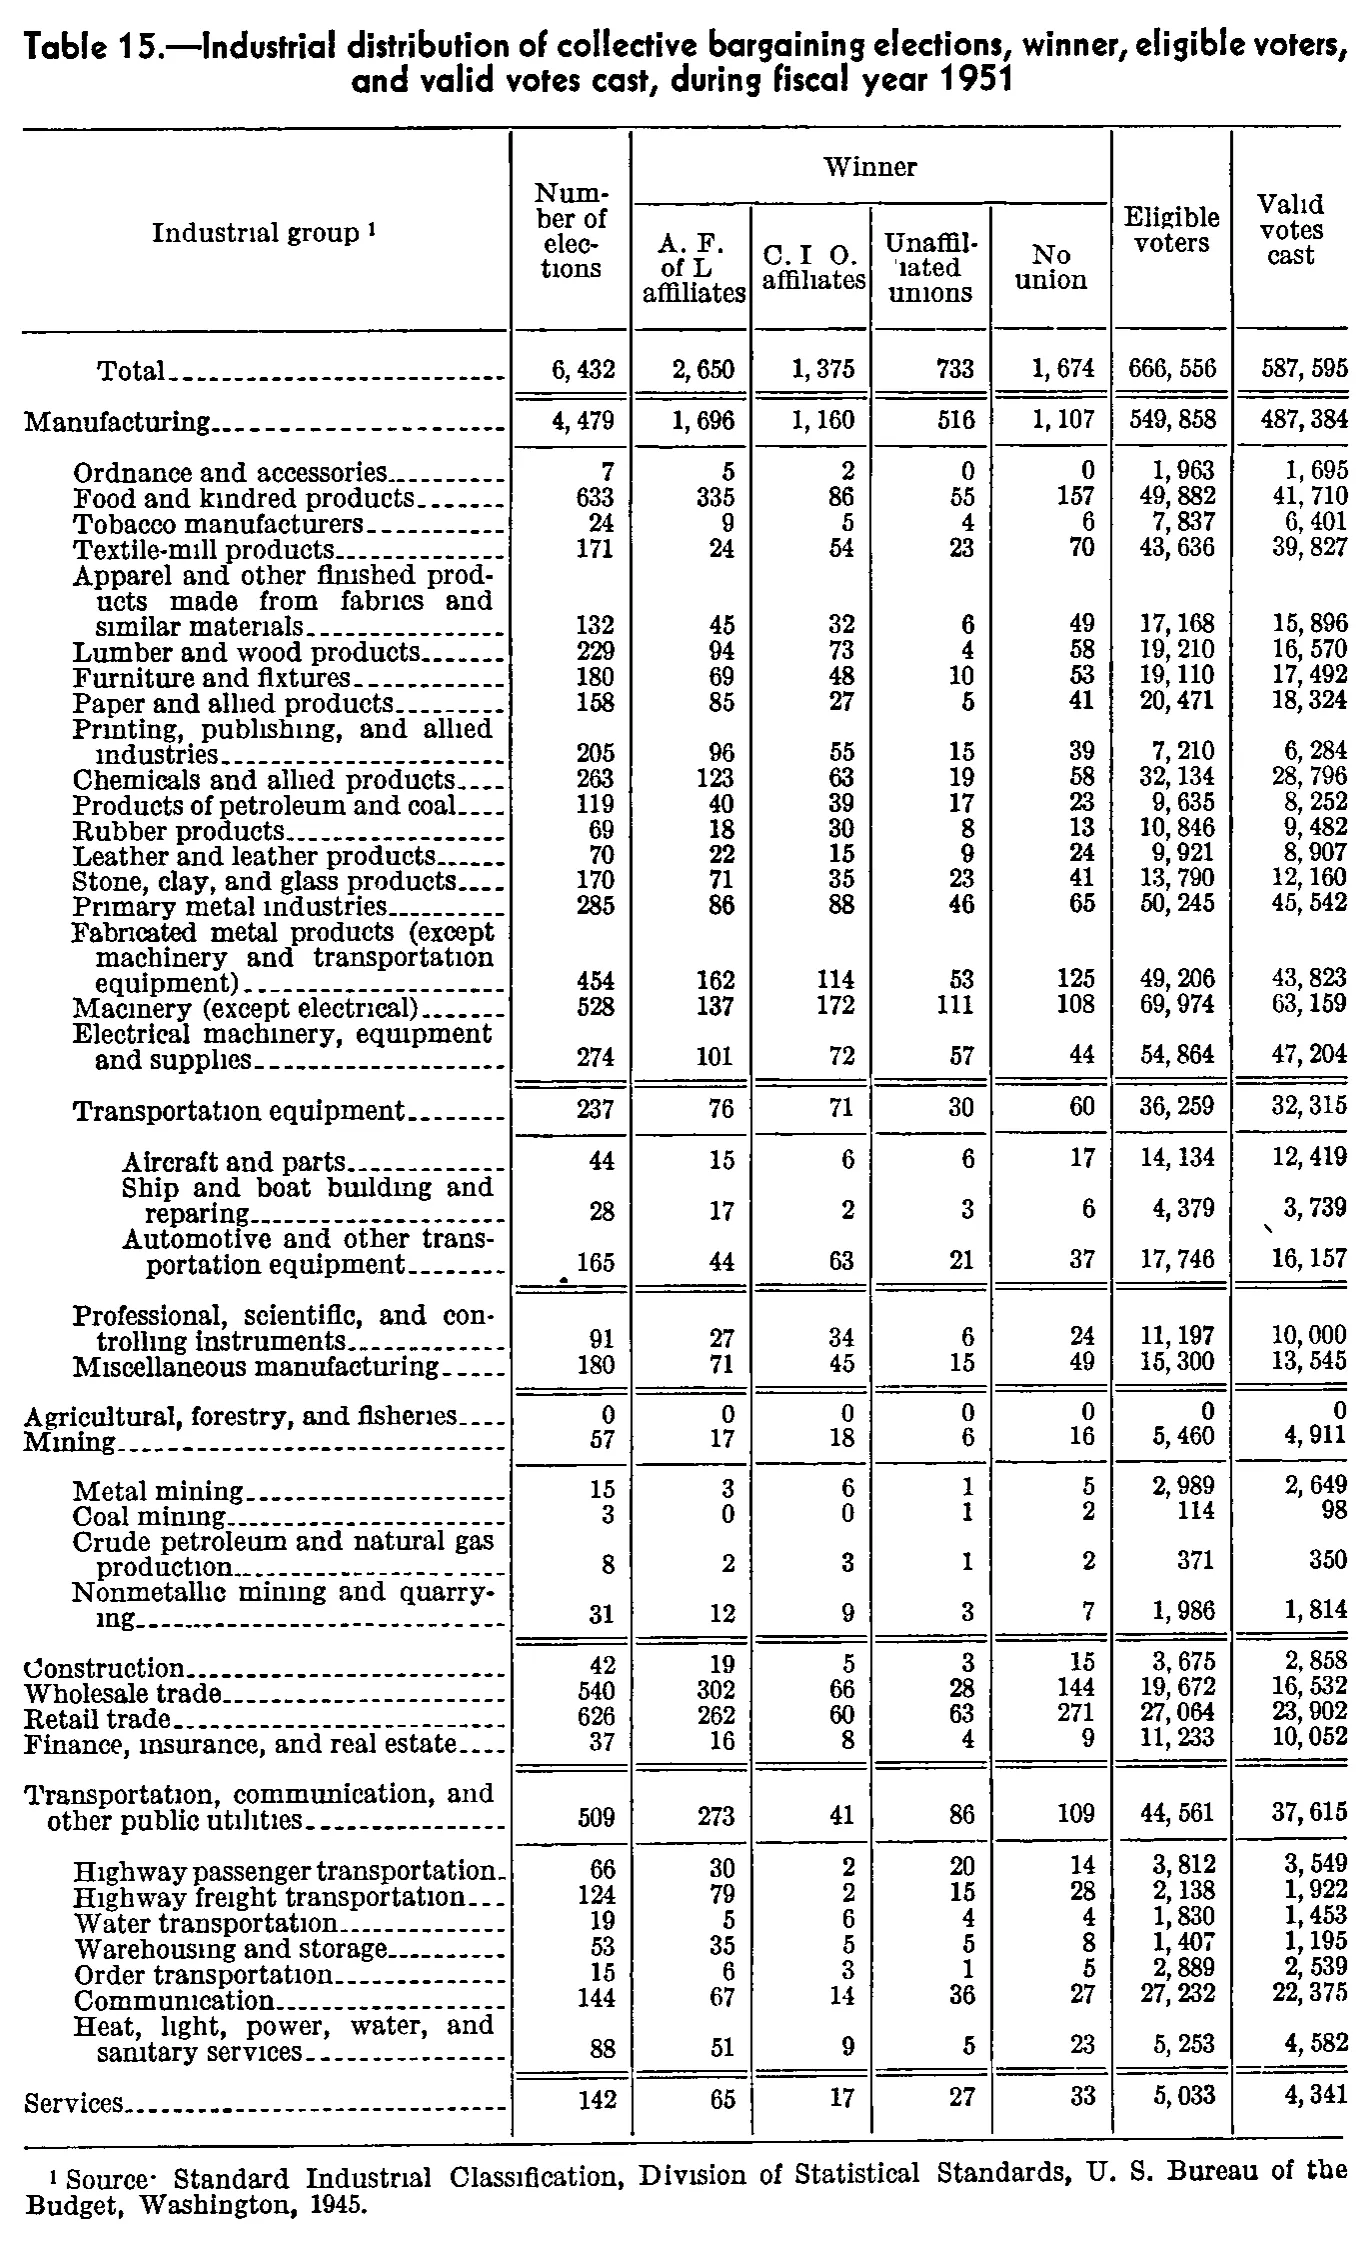
Industrial distribution of collective bargaining elections, winner, eligible voters, and valid votes cast, during fiscal year 1951
| Industrial group | Number of elections | Winner | Eligible voters | Valid votes cast | |||
|---|---|---|---|---|---|---|---|
| Industrial group | Number of elections | A. F. of L. affiliates | C. I. O. affiliates | Unaffiliated unions | No union | Eligible voters | Valid votes cast |
| Total | 6,432 | 2,650 | 1,375 | 733 | 1,674 | 666,556 | 587,595 |
| Manufacturing | 4,479 | 1,696 | 1,160 | 516 | 1,107 | 549,858 | 487,384 |
| Ordnance and accessories | 7 | 5 | 2 | 0 | 0 | 1,963 | 1,695 |
| Food and kindred products | 633 | 335 | 86 | 55 | 157 | 49,882 | 41,710 |
| Tobacco manufacturers | 24 | 9 | 5 | 4 | 6 | 7,837 | 6,401 |
| Textile-mill products | 171 | 24 | 54 | 23 | 70 | 43,636 | 39,827 |
| Apparel and other finished products made from fabrics and similar materials | 132 | 45 | 32 | 6 | 49 | 17,168 | 15,896 |
| Lumber and wood products | 229 | 94 | 73 | 4 | 58 | 19,210 | 16,570 |
| Furniture and fixtures | 180 | 69 | 48 | 10 | 53 | 19,110 | 17,492 |
| Paper and allied products | 158 | 85 | 27 | 5 | 41 | 20,471 | 18,324 |
| Printing, publishing, and allied industries | 205 | 96 | 55 | 15 | 39 | 7,210 | 6,284 |
| Chemicals and allied products | 263 | 123 | 63 | 19 | 58 | 32,134 | 28,796 |
| Products of petroleum and coal | 119 | 40 | 39 | 17 | 23 | 9,635 | 8,252 |
| Rubber products | 69 | 18 | 30 | 8 | 13 | 10,846 | 9,482 |
| Leather and leather products | 70 | 22 | 15 | 9 | 24 | 9,921 | 8,907 |
| Stone, clay, and glass products | 170 | 71 | 35 | 23 | 41 | 13,790 | 12,160 |
| Primary metal industries | 285 | 86 | 88 | 46 | 65 | 50,245 | 45,542 |
| Fabricated metal products (except machinery and transportation equipment) | 454 | 162 | 114 | 53 | 125 | 49,206 | 43,823 |
| Macinery (except electrical) | 528 | 137 | 172 | 111 | 108 | 69,974 | 63,159 |
| Electrical machinery, equipment and supplies | 274 | 101 | 72 | 57 | 44 | 54,864 | 47,204 |
| Transportation equipment | 237 | 76 | 71 | 30 | 60 | 36,259 | 32,315 |
| Aircraft and parts | 44 | 15 | 6 | 6 | 17 | 14,134 | 12,419 |
| Ship and boat building and reparing | 28 | 17 | 2 | 3 | 6 | 4,379 | 3,739 |
| Automotive and other transportation equipment | 165 | 44 | 63 | 21 | 37 | 17,746 | 16,157 |
| Professional, scientific, and controlling instruments | 91 | 27 | 34 | 6 | 24 | 11,197 | 10,000 |
| Miscellaneous manufacturing | 180 | 71 | 45 | 15 | 49 | 15,300 | 13,545 |
| Agricultural, forestry, and fisheries | 0 | 0 | 0 | 0 | 0 | 0 | 0 |
| Mining | 57 | 17 | 18 | 6 | 16 | 5,460 | 4,911 |
| Metal mining | 15 | 3 | 6 | 1 | 5 | 2,989 | 2,649 |
| Coal mining | 3 | 0 | 0 | 1 | 2 | 114 | 98 |
| Crude petroleum and natural gas production | 8 | 2 | 3 | 1 | 2 | 371 | 350 |
| Nonmetallic mining and quarrying | 31 | 12 | 9 | 3 | 7 | 1,986 | 1,814 |
| Construction | 42 | 19 | 5 | 3 | 15 | 3,675 | 2,858 |
| Wholesale trade | 540 | 302 | 66 | 28 | 144 | 19,672 | 16,532 |
| Retail trade | 626 | 262 | 60 | 63 | 271 | 27,064 | 23,902 |
| Finance, insurance, and real estate | 37 | 16 | 8 | 4 | 9 | 11,233 | 10,052 |
| Transportation, communication, and other public utilities | 509 | 273 | 41 | 86 | 109 | 44,561 | 37,615 |
| Highway passenger transportation | 66 | 30 | 2 | 20 | 14 | 3,812 | 3,549 |
| Highway freight transportation | 124 | 79 | 2 | 15 | 28 | 2,138 | 1,922 |
| Water transportation | 19 | 5 | 6 | 4 | 4 | 1,830 | 1,453 |
| Warehousing and storage | 53 | 35 | 5 | 5 | 8 | 1,407 | 1,195 |
| Order transportation | 15 | 6 | 3 | 1 | 5 | 2,889 | 2,539 |
| Communication | 144 | 67 | 14 | 36 | 27 | 27,232 | 22,375 |
| Heat, light, power, water, and sanitary services | 88 | 51 | 9 | 5 | 23 | 5,253 | 4,582 |
| Services | 142 | 65 | 17 | 27 | 33 | 5,033 | 4,341 |
- 1 Source: Standard Industrial Classification, Division of Statistical Standards, U. S. Bureau of the Budget, Washington, 1945.
303 of 304 figures sit in a row or column sum that works out. 2 cells break a sum: 'Retail trade', column 2: prints 626, columns 3 to 6 add to 656; 'Total', column 6: prints 1,674, the subtotals in rows 'Manufacturing' to 'Services' add to 1,704.
Reader’s notes
p. 320. Suspected misprint, "Retail trade" row, "No union" column: the cell reads 271 on close inspection, but that value is inconsistent with the rest of the table in two ways. (a) Within the row, 262 + 60 + 63 + 271 = 656, while the printed "Number of elections" for Retail trade is 626. (b) Down the "No union" column, the nine major-group rows (Manufacturing 1,107; Agricultural 0; Mining 16; Construction 15; Wholesale 144; Retail 271; Finance 9; Transportation 109; Services 33) sum to 1,704, while the printed Total is 1,674. Both discrepancies are exactly 30 and both vanish if the cell is 241, so the digit is most likely a 4 that scans as a 7, or the figure is a printing error. Transcribed as it appears (271) per instructions. Every other row and column in the table cross-foots exactly: all seven value columns of the Manufacturing block sum to the printed Manufacturing line; the Mining, Transportation-equipment and Transportation/communication sub-blocks sum to their group lines; and the "Number of elections", "A. F. of L.", "C. I. O.", "Unaffiliated unions", "Eligible voters" and "Valid votes cast" columns all sum to the printed Total. Apparent typesetting errors in row labels, transcribed as printed: "Macinery (except electrical)" (for "Machinery"); "Ship and boat building and reparing" (for "repairing"); "Tobacco manufacturers" (the SIC term is "Tobacco manufactures"); "Agricultural, forestry, and fisheries" (usually "Agriculture, forestry, and fisheries"). "Order transportation" is a doubtful reading: the SIC category in companion NLRB tables is "Other transportation", and the printed word could be "Other" with the "th" ligature degraded by the scan. Transcribed as it appears. Column headings: the trailing periods in "A. F. of L." and the period after the "I" in "C. I. O." are not visible in the scan (they render as "A. F. of L" and "C. I O."); the standard forms are given on the assumption that small periods were lost in the 1-bit scan. "Number of elections", "Eligible voters" and "Valid votes cast" are tall single headings spanning both heading levels, so they are repeated in both rows, as is the stub heading. "Winner" spans the four middle columns. The scan carries a few stray specks that are not part of the table: a small mark left of the "Automotive and other transportation equipment" figures and a short diagonal stroke above the "3,739" in the "Valid votes cast" column of the "Ship and boat building and reparing" row. Neither is a footnote marker.
Source image
Source data: U.S. NLRB Annual Reports (public domain). Reconstruction by NLRB Stats Archive. Read by claude-opus-5 (effort max, prompt extract_v1) from the 300-dpi scan; stitched by page. Updated October 2026.