NLRB Stats Archive › Annual Reports › FY1950 › Geographic distribution of decertification elections, eligible voters, and number of votes cast for participating unions, during fiscal year 1950
Geographic distribution of decertification elections, eligible voters, and number of votes cast for participating unions, during fiscal year 1950
Stitched from pp. 257–258.
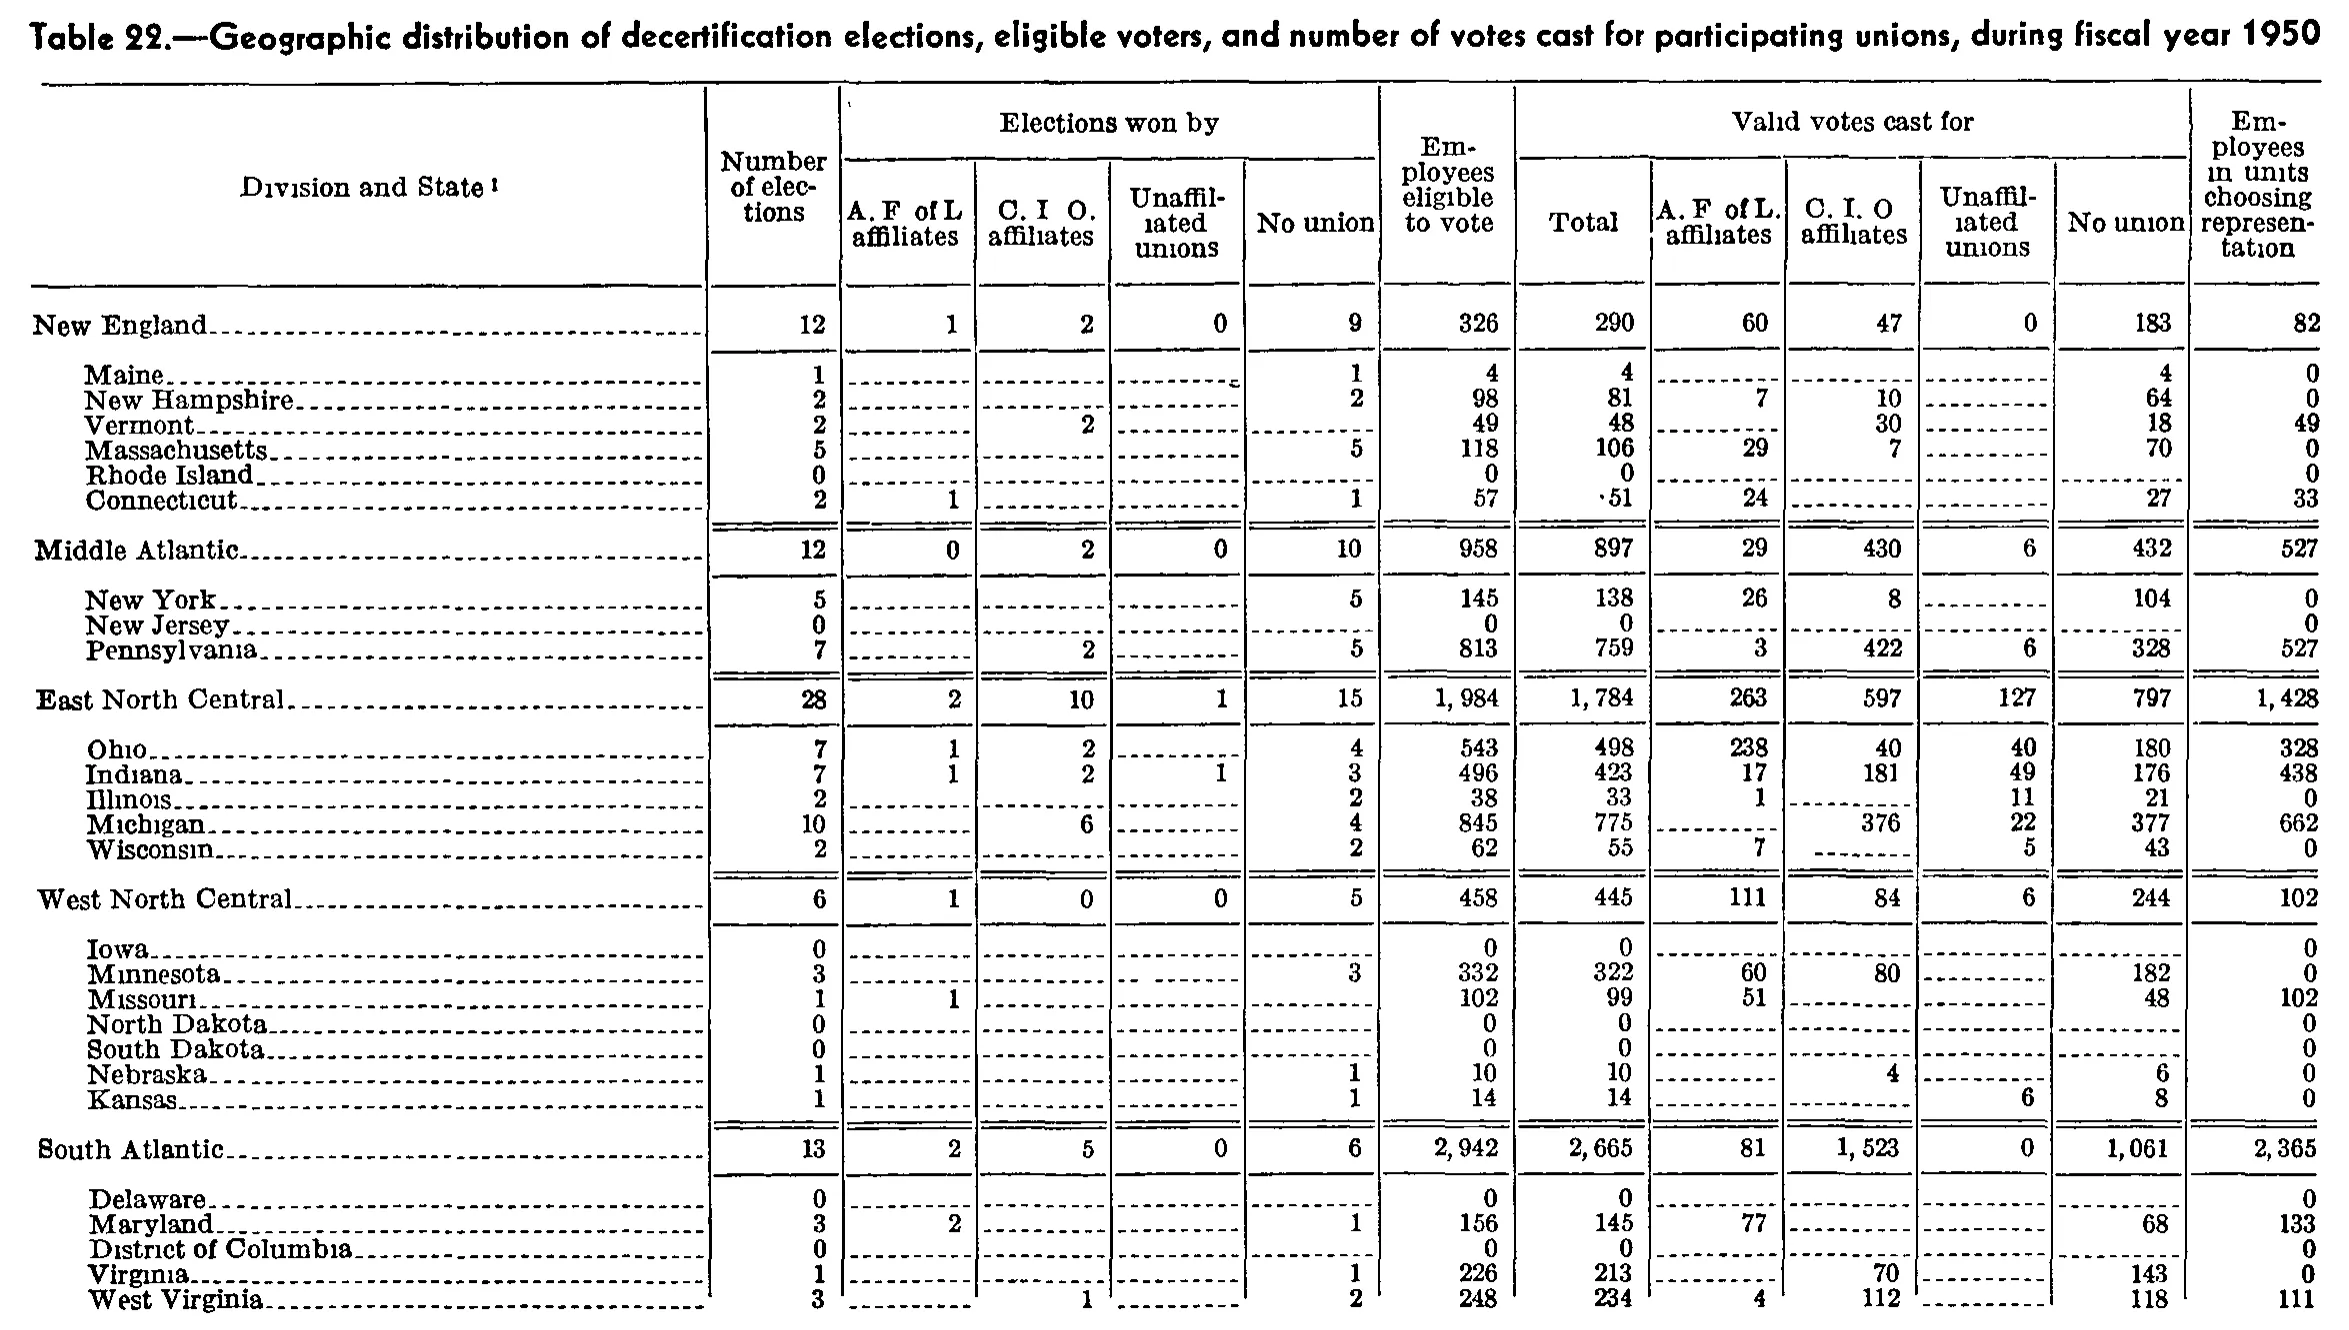
| Division and State | Number of elections | Elections won by | Employees eligible to vote | Valid votes cast for | Employees in units choosing representation | |||||||
|---|---|---|---|---|---|---|---|---|---|---|---|---|
| Division and State | Number of elections | A. F of L affiliates | C. I. O. affiliates | Unaffiliated unions | No union | Employees eligible to vote | Total | A. F of L. affiliates | C. I. O. affiliates | Unaffiliated unions | No union | Employees in units choosing representation |
| New England | 12 | 1 | 2 | 0 | 9 | 326 | 290 | 60 | 47 | 0 | 183 | 82 |
| Maine | 1 | 1 | 4 | 4 | 4 | 0 | ||||||
| New Hampshire | 2 | 2 | 98 | 81 | 7 | 10 | 64 | 0 | ||||
| Vermont | 2 | 2 | 49 | 48 | 30 | 18 | 49 | |||||
| Massachusetts | 5 | 5 | 118 | 106 | 29 | 7 | 70 | 0 | ||||
| Rhode Island | 0 | 0 | 0 | 0 | ||||||||
| Connecticut | 2 | 1 | 1 | 57 | 51 | 24 | 27 | 33 | ||||
| Middle Atlantic | 12 | 0 | 2 | 0 | 10 | 958 | 897 | 29 | 430 | 6 | 432 | 527 |
| New York | 5 | 5 | 145 | 138 | 26 | 8 | 104 | 0 | ||||
| New Jersey | 0 | 0 | 0 | 0 | ||||||||
| Pennsylvania | 7 | 2 | 5 | 813 | 759 | 3 | 422 | 6 | 328 | 527 | ||
| East North Central | 28 | 2 | 10 | 1 | 15 | 1,984 | 1,784 | 263 | 597 | 127 | 797 | 1,428 |
| Ohio | 7 | 1 | 2 | 4 | 543 | 498 | 238 | 40 | 40 | 180 | 328 | |
| Indiana | 7 | 1 | 2 | 1 | 3 | 496 | 423 | 17 | 181 | 49 | 176 | 438 |
| Illinois | 2 | 2 | 38 | 33 | 1 | 11 | 21 | 0 | ||||
| Michigan | 10 | 6 | 4 | 845 | 775 | 376 | 22 | 377 | 662 | |||
| Wisconsin | 2 | 2 | 62 | 55 | 7 | 5 | 43 | 0 | ||||
| West North Central | 6 | 1 | 0 | 0 | 5 | 458 | 445 | 111 | 84 | 6 | 244 | 102 |
| Iowa | 0 | 0 | 0 | 0 | ||||||||
| Minnesota | 3 | 3 | 332 | 322 | 60 | 80 | 182 | 0 | ||||
| Missouri | 1 | 1 | 102 | 99 | 51 | 48 | 102 | |||||
| North Dakota | 0 | 0 | 0 | 0 | ||||||||
| South Dakota | 0 | 0 | 0 | 0 | ||||||||
| Nebraska | 1 | 1 | 10 | 10 | 4 | 6 | 0 | |||||
| Kansas | 1 | 1 | 14 | 14 | 6 | 8 | 0 | |||||
| South Atlantic | 13 | 2 | 5 | 0 | 6 | 2,942 | 2,665 | 81 | 1,523 | 0 | 1,061 | 2,365 |
| Delaware | 0 | 0 | 0 | 0 | ||||||||
| Maryland | 3 | 2 | 1 | 156 | 145 | 77 | 68 | 133 | ||||
| District of Columbia | 0 | 0 | 0 | 0 | ||||||||
| Virginia | 1 | 1 | 226 | 213 | 70 | 143 | 0 | |||||
| West Virginia | 3 | 1 | 2 | 248 | 234 | 4 | 112 | 118 | 111 | |||
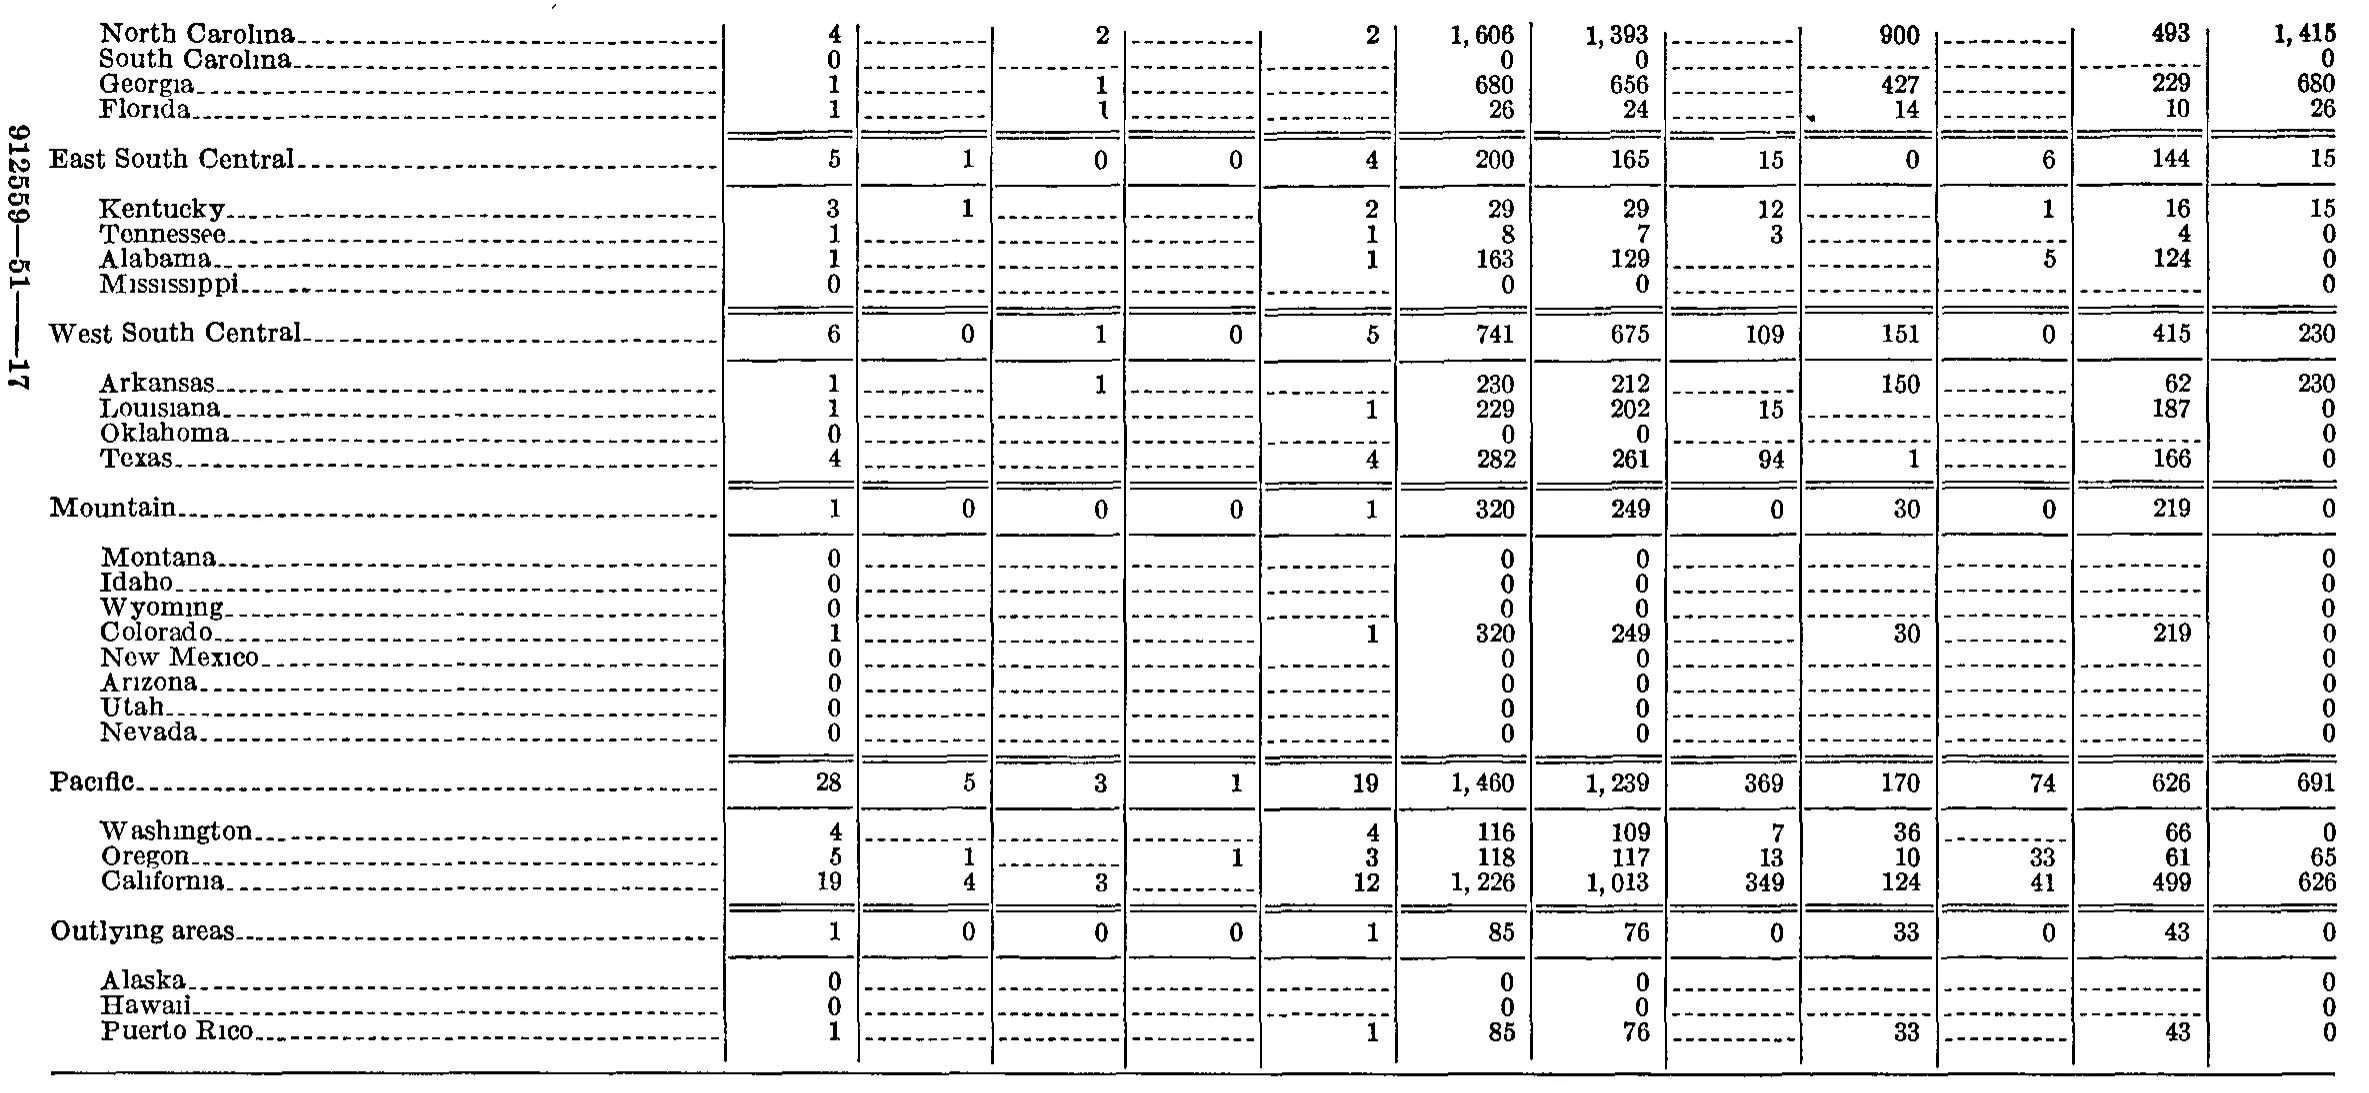
| North Carolina | 4 | 2 | 2 | 1,606 | 1,393 | 900 | 493 | 1,415 | ||||
| South Carolina | 0 | 0 | 0 | 0 | ||||||||
| Georgia | 1 | 1 | 680 | 656 | 427 | 229 | 680 | |||||
| Florida | 1 | 1 | 26 | 24 | 14 | 10 | 26 | |||||
| East South Central | 5 | 1 | 0 | 0 | 4 | 200 | 165 | 15 | 0 | 6 | 144 | 15 |
| Kentucky | 3 | 1 | 2 | 29 | 29 | 12 | 1 | 16 | 15 | |||
| Tennessee | 1 | 1 | 8 | 7 | 3 | 4 | 0 | |||||
| Alabama | 1 | 1 | 163 | 129 | 5 | 124 | 0 | |||||
| Mississippi | 0 | 0 | 0 | 0 | ||||||||
| West South Central | 6 | 0 | 1 | 0 | 5 | 741 | 675 | 109 | 151 | 0 | 415 | 230 |
| Arkansas | 1 | 1 | 230 | 212 | 150 | 62 | 230 | |||||
| Louisiana | 1 | 1 | 229 | 202 | 15 | 187 | 0 | |||||
| Oklahoma | 0 | 0 | 0 | 0 | ||||||||
| Texas | 4 | 4 | 282 | 261 | 94 | 1 | 166 | 0 | ||||
| Mountain | 1 | 0 | 0 | 0 | 1 | 320 | 249 | 0 | 30 | 0 | 219 | 0 |
| Montana | 0 | 0 | 0 | 0 | ||||||||
| Idaho | 0 | 0 | 0 | 0 | ||||||||
| Wyoming | 0 | 0 | 0 | 0 | ||||||||
| Colorado | 1 | 1 | 320 | 249 | 30 | 219 | 0 | |||||
| New Mexico | 0 | 0 | 0 | 0 | ||||||||
| Arizona | 0 | 0 | 0 | 0 | ||||||||
| Utah | 0 | 0 | 0 | 0 | ||||||||
| Nevada | 0 | 0 | 0 | 0 | ||||||||
| Pacific | 28 | 5 | 3 | 1 | 19 | 1,460 | 1,239 | 369 | 170 | 74 | 626 | 691 |
| Washington | 4 | 4 | 116 | 109 | 7 | 36 | 66 | 0 | ||||
| Oregon | 5 | 1 | 1 | 3 | 118 | 117 | 13 | 10 | 33 | 61 | 65 | |
| California | 19 | 4 | 3 | 12 | 1,226 | 1,013 | 349 | 124 | 41 | 499 | 626 | |
| Outlying areas | 1 | 0 | 0 | 0 | 1 | 85 | 76 | 0 | 33 | 0 | 43 | 0 |
| Alaska | 0 | 0 | 0 | 0 | ||||||||
| Hawaii | 0 | 0 | 0 | 0 | ||||||||
| Puerto Rico | 1 | 1 | 85 | 76 | 33 | 43 | 0 | |||||
344 of 344 figures sit in a row or column sum that works out.
Reader’s notes
p. 257. The crop is cut off at the bottom: the table continues past "West Virginia" (the South Atlantic division is incomplete — the remaining South Atlantic States and all later divisions, plus any grand total, are not on this image). The stub heading carries a raised footnote marker ("Division and State^1"), but the footnote text itself falls below the crop, so `footnotes` is empty. Column structure: 13 columns — stub, "Number of elections", four columns under "Elections won by", "Employees eligible to vote", five columns under "Valid votes cast for", and "Employees in units choosing representation". "Number of elections", "Employees eligible to vote" and "Employees in units choosing representation" are tall single headings spanning both heading levels and are repeated in both rows. Doubtful cell: Connecticut, "Valid votes cast for — Total" is printed as "·51" with a stray dot immediately before the 51 (a leader-dot/scan artifact); transcribed as 51. Column arithmetic supports 51 (24 + 27 = 51). Minor artifact: the Maine row shows a small stray mark at the right end of the leader dots in the "Elections won by — Unaffiliated unions" column; it is not a digit and the cell is treated as blank. Internal arithmetic checks out for every division subtotal shown (New England, Middle Atlantic, East North Central, West North Central), so no misprints are suspected in the transcribed values.
p. 258. Continuation page: no column headings are printed on this crop, so header_rows is empty. The grid is 13 columns (stub + 12 data columns), counted from the column rules and confirmed by the fully populated region-total rows. The crop begins mid-group: North Carolina, South Carolina, Georgia and Florida are the last states of a region (South Atlantic) whose group label and total line fall on the previous page. The region rows that are present here (East South Central, West South Central, Mountain, Pacific, Outlying areas) are totals printed above their member states, each set off by double rules. Most state rows are sparse, with leader-dash segments in the empty cells. I placed each printed value under its own column using those dash segments, and then checked every placement against the printed arithmetic: each region total equals the sum of its states column by column (e.g. East South Central col 8 = 12 + 3 = 15, col 10 = 1 + 5 = 6, col 11 = 16 + 4 + 124 = 144), and within each row column 1 = cols 2-5 and column 7 = cols 8-11 (e.g. Washington 7 + 36 + 66 = 109; California 349 + 124 + 41 + 499 = 1,013). All rows reconcile as transcribed; no printed total appears to be in error. Two cells warranted a second look. Georgia's 427 and Florida's 14 sit slightly left of North Carolina's 900 on the page, but all three are in the same column (col 9): each is a majority of its row's valid-vote total (427 of 656, 14 of 24, 900 of 1,393), and each of those rows carries its single election in col 3, so the votes must belong to the col 3 / col 9 pair rather than col 8. Florida's 14 also has a small stray ink mark just to its left, on the column rule; I read it as a scanning artifact, not a digit or a footnote marker. Florida's col 3 entry is printed with a slab-serif "1" that resembles a lowercase "l"; transcribed as 1, consistent with the group arithmetic. The vertical string "912559—51——17" running down the left margin is the printer's signature mark, not a table cell, and is excluded.
Source image
Source data: U.S. NLRB Annual Reports (public domain). Reconstruction by NLRB Stats Archive. Read by claude-opus-5 (effort max, prompt extract_v1) from the 300-dpi scan; stitched by page. Updated October 2026.