NLRB Stats Archive › Annual Reports › FY1950 › Collective bargaining elections, eligible voters, and valid votes cast — by State
Collective bargaining elections, eligible voters, and valid votes cast — by State
| Division and State | Number of elections | AFL affiliates won | CIO affiliates won | Unaffiliated unions won | No union won | Employees eligible to vote | Total valid votes cast | Valid votes for AFL affiliates | Valid votes for CIO affiliates | Valid votes for Unaffiliated unions | Valid votes for No union | Employees in units choosing representation |
|---|---|---|---|---|---|---|---|---|---|---|---|---|
| South Atlantic — total | 387 | 138 | 68 | 37 | 144 | 113,912 | 90,465 | 12,997 | 40,989 | 8,374 | 28,040 | 59,209 |
| East South Central — total | 243 | 99 | 43 | 17 | 80 | 28,343 | 25,313 | 3,795 | 8,173 | 4,977 | 5,967 | 20,950 |
| West South Central — total | 296 | 91 | 74 | 41 | 90 | 37,178 | 34,791 | 4,450 | 14,210 | 8,600 | 7,541 | 31,799 |
| Mountain — total | 220 | 103 | 21 | 40 | 56 | 9,374 | 8,152 | 2,807 | 1,692 | 2,024 | 1,630 | 7,697 |
| Pacific — total | 684 | 292 | 91 | 126 | 175 | 91,539 | 75,847 | 29,231 | 16,302 | 18,812 | 13,477 | 76,339 |
| Outlying areas — total | 94 | 59 | 12 | 5 | 18 | 8,124 | 6,428 | 1,790 | 445 | 2,489 | 1,704 | 6,689 |
Source image
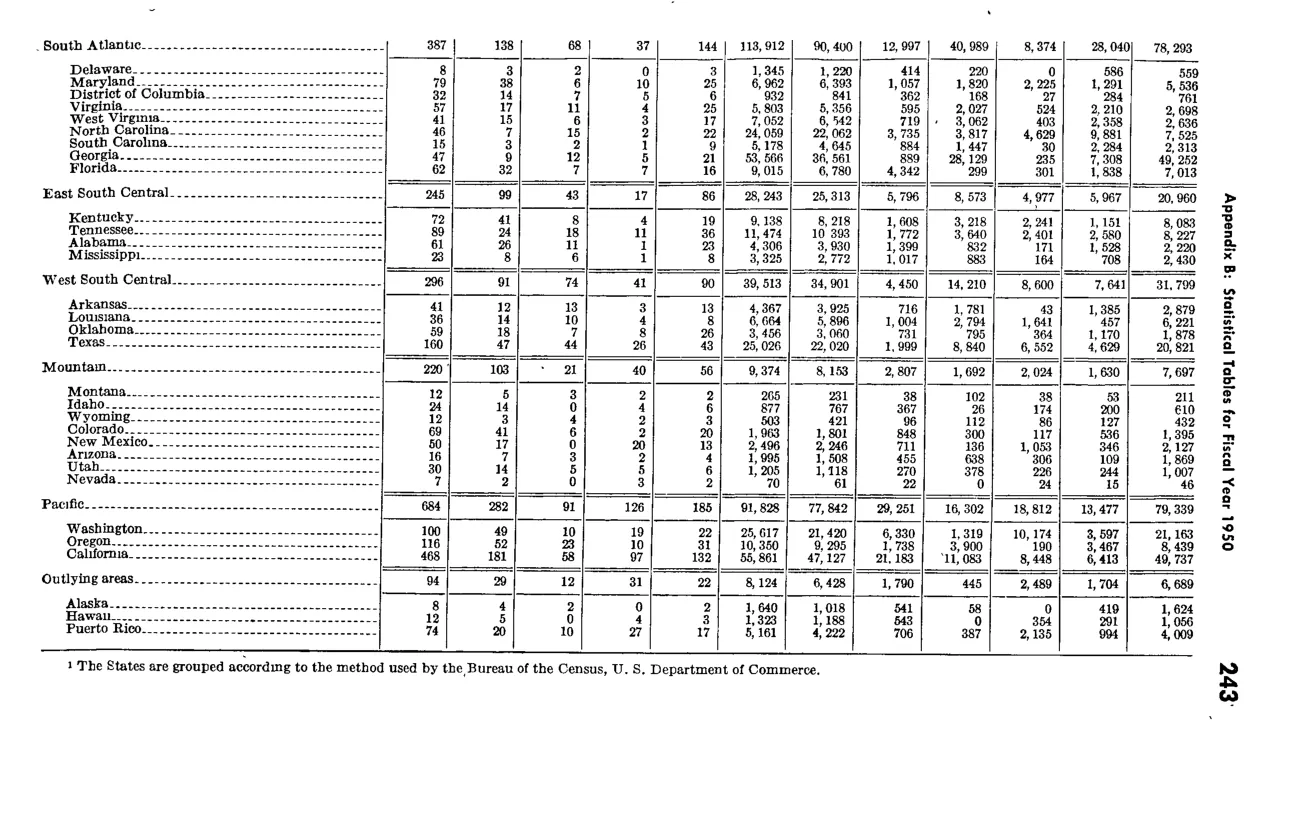
Source data: U.S. NLRB Annual Reports (public domain). Reconstruction by NLRB Stats Archive. Updated June 2026.