NLRB Stats Archive › Annual Reports › FY1950 › Cases — by industry
Cases — by industry
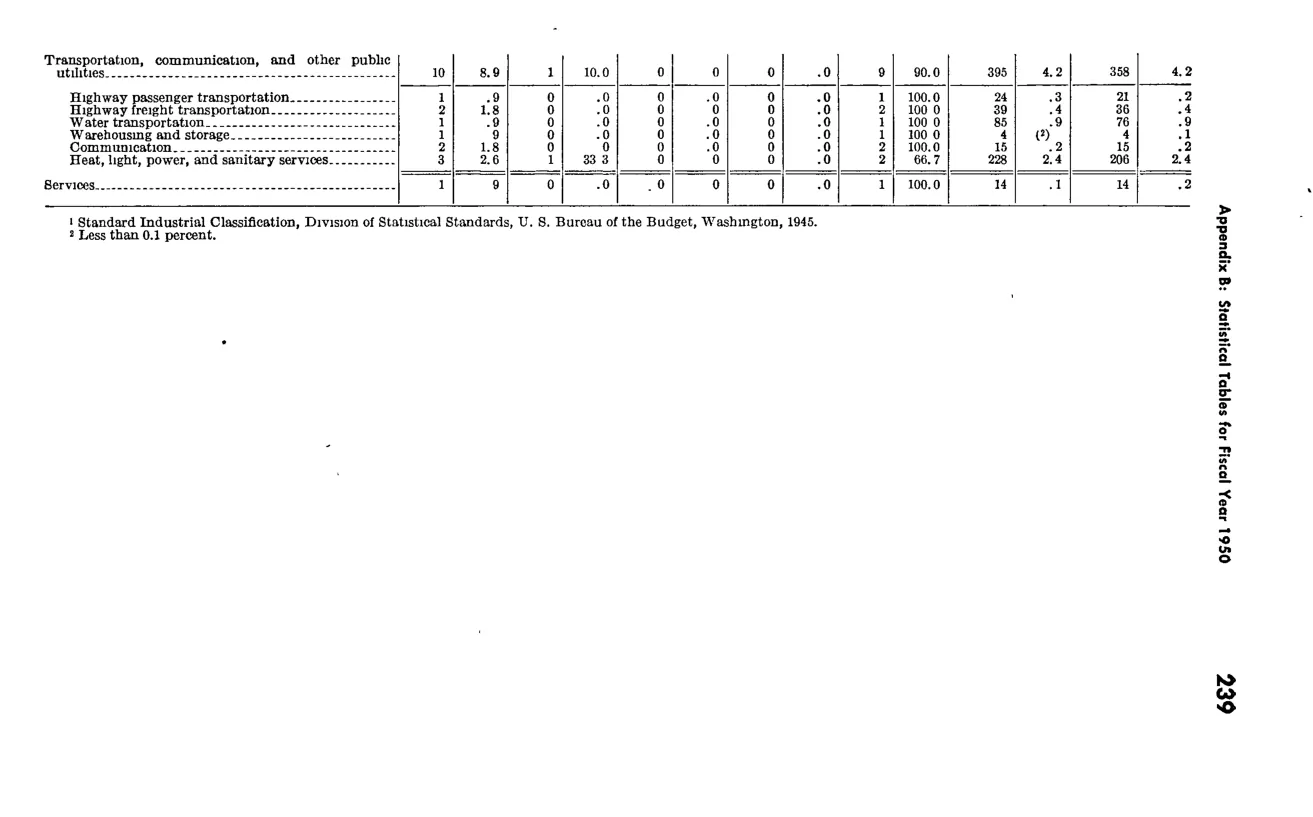
| Highway passenger transportation | 1 | 0.9 | 0 | 0 | 0 | 1 | 100 | 24 | 0.3 | 21 | 0.2 |
|---|---|---|---|---|---|---|---|---|---|---|---|
| Highway freight transportation | 2 | 1.8 | 0 | 0 | 0 | 2 | 100 0 | 39 | 0.4 | 36 | 0.4 |
| Water transportation | 1 | 0.9 | 0 | 0 | 0 | 1 | 100 0 | 85 | 0.9 | 76 | 0.9 |
| Warehousing and storage | 1 | 9 | 0 | . 0 | 0 | 1 | 100 0 | 4 | (2) | 4 | 0.1 |
| Communication | 2 | 1.8 | 0 | 0 | 0 | 2 | 100 | 15 | . 2 | 15 | 0.2 |
| Heat, light, power, and sanitary services | 3 | 2.6 | 33 3 | 0 | 0 | 2 | 66.7 | 228 | 2.4 | 206 | 2.4 |
| Services | 1 | 9 | 0 | 0 | 0 | 1 | 100 | 14 | 0.1 | 14 | 0.2 |
Source image
Source data: U.S. NLRB Annual Reports (public domain). Reconstruction by NLRB Stats Archive. Updated June 2026.