NLRB Stats Archive › Annual Reports › FY1950 › Regional distribution of cases received during fiscal year 1950
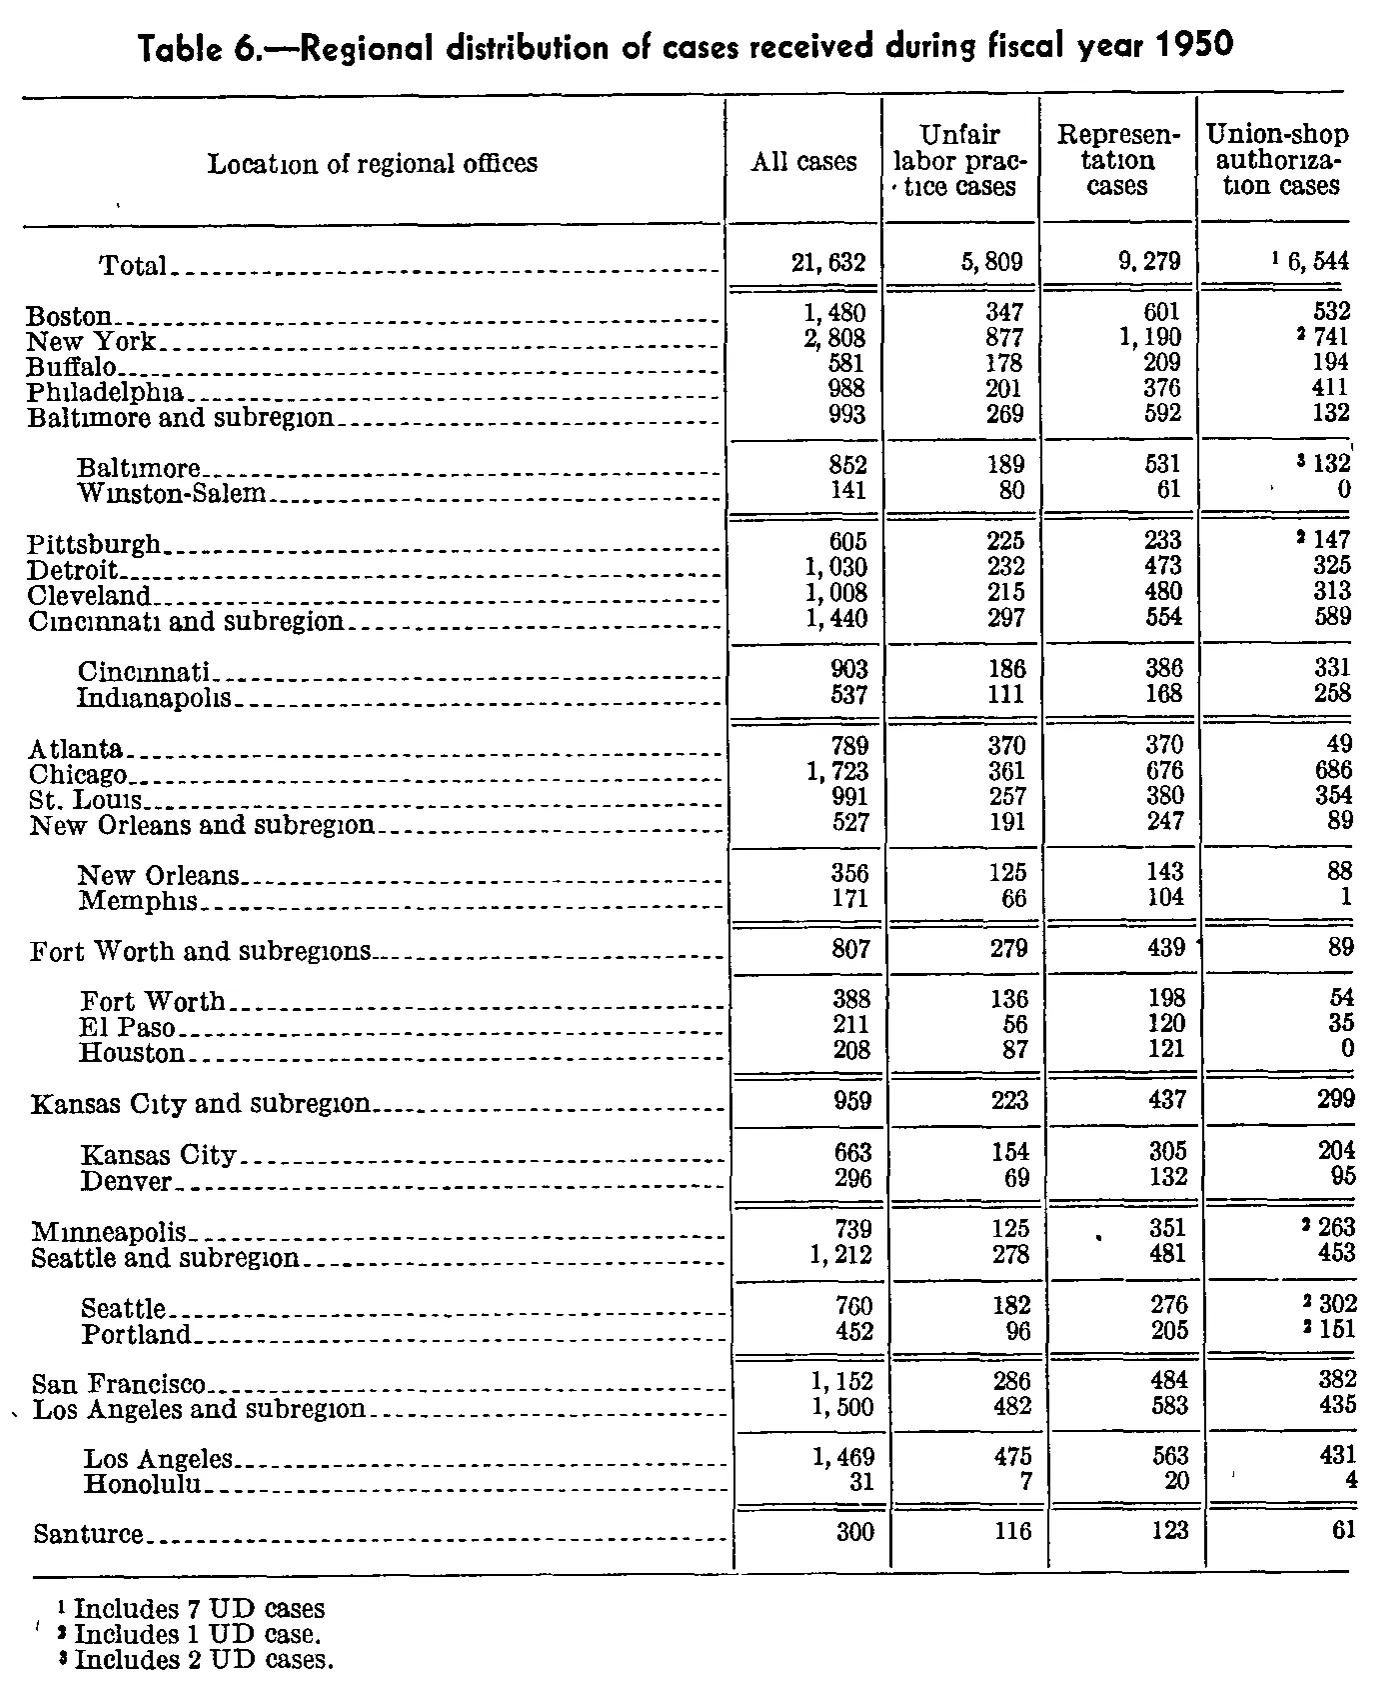
Regional distribution of cases received during fiscal year 1950
| Location of regional offices | All cases | Unfair labor practice cases | Representation cases | Union-shop authorization cases |
|---|---|---|---|---|
| Total | 21,632 | 5,809 | 9,279 | 6,544 |
| Boston | 1,480 | 347 | 601 | 532 |
| New York | 2,808 | 877 | 1,190 | 741 |
| Buffalo | 581 | 178 | 209 | 194 |
| Philadelphia | 988 | 201 | 376 | 411 |
| Baltimore and subregion | 993 | 269 | 592 | 132 |
| Baltimore | 852 | 189 | 531 | 132 |
| Winston-Salem | 141 | 80 | 61 | 0 |
| Pittsburgh | 605 | 225 | 233 | 147 |
| Detroit | 1,030 | 232 | 473 | 325 |
| Cleveland | 1,008 | 215 | 480 | 313 |
| Cincinnati and subregion | 1,440 | 297 | 554 | 589 |
| Cincinnati | 903 | 186 | 386 | 331 |
| Indianapolis | 537 | 111 | 168 | 258 |
| Atlanta | 789 | 370 | 370 | 49 |
| Chicago | 1,723 | 361 | 676 | 686 |
| St. Louis | 991 | 257 | 380 | 354 |
| New Orleans and subregion | 527 | 191 | 247 | 89 |
| New Orleans | 356 | 125 | 143 | 88 |
| Memphis | 171 | 66 | 104 | 1 |
| Fort Worth and subregions | 807 | 279 | 439 | 89 |
| Fort Worth | 388 | 136 | 198 | 54 |
| El Paso | 211 | 56 | 120 | 35 |
| Houston | 208 | 87 | 121 | 0 |
| Kansas City and subregion | 959 | 223 | 437 | 299 |
| Kansas City | 663 | 154 | 305 | 204 |
| Denver | 296 | 69 | 132 | 95 |
| Minneapolis | 739 | 125 | 351 | 263 |
| Seattle and subregion | 1,212 | 278 | 481 | 453 |
| Seattle | 760 | 182 | 276 | 302 |
| Portland | 452 | 96 | 205 | 151 |
| San Francisco | 1,152 | 286 | 484 | 382 |
| Los Angeles and subregion | 1,500 | 482 | 583 | 435 |
| Los Angeles | 1,469 | 475 | 563 | 431 |
| Honolulu | 31 | 7 | 20 | 4 |
| Santurce | 300 | 116 | 123 | 61 |
- 1 Includes 7 UD cases
- 2 Includes 1 UD case.
- 3 Includes 2 UD cases.
142 of 142 figures sit in a row or column sum that works out.
Reader’s notes
p. 238. The table has 4 data columns under a single heading level; the stub heading is "Location of regional offices". Rows for sub-offices (Baltimore, Winston-Salem, Cincinnati, Indianapolis, New Orleans, Memphis, Fort Worth, El Paso, Houston, Kansas City, Denver, Seattle, Portland, Los Angeles, Honolulu) are printed indented under their "... and subregion(s)" parent rows; indentation is not represented in the grid but the label wording is as printed. Footnote markers in the "Union-shop authorization cases" column are printed as raised digits to the LEFT of the figure (e.g. the Total cell reads "1 6,544" with a raised 1); they are transcribed after the value behind a caret. The raised marker on Portland's 151 is faintly printed and could be read as 2 or 3; I read it as 2, which is consistent with the footnote arithmetic (five cells marked 2 at 1 UD case each plus Baltimore's marker 3 at 2 UD cases = the 7 UD cases of footnote 1). Baltimore's marker on 132 is likewise slightly blurred but reads as 3. Footnote 1 appears to end without a period as printed. No arithmetic problems detected: every row's three components sum to its "All cases" figure, each "and subregion" subtotal equals the sum of its sub-offices in all four columns, and the top-level regions sum to the printed Total of 21,632 (5,809 + 9,279 + 6,544).
Source image
Source data: U.S. NLRB Annual Reports (public domain). Reconstruction by NLRB Stats Archive. Read by claude-opus-5 (effort max, prompt extract_v1) from the 300-dpi scan; stitched by page. Updated October 2026.