NLRB Stats Archive › Annual Reports › FY1950 › Cases received — by region
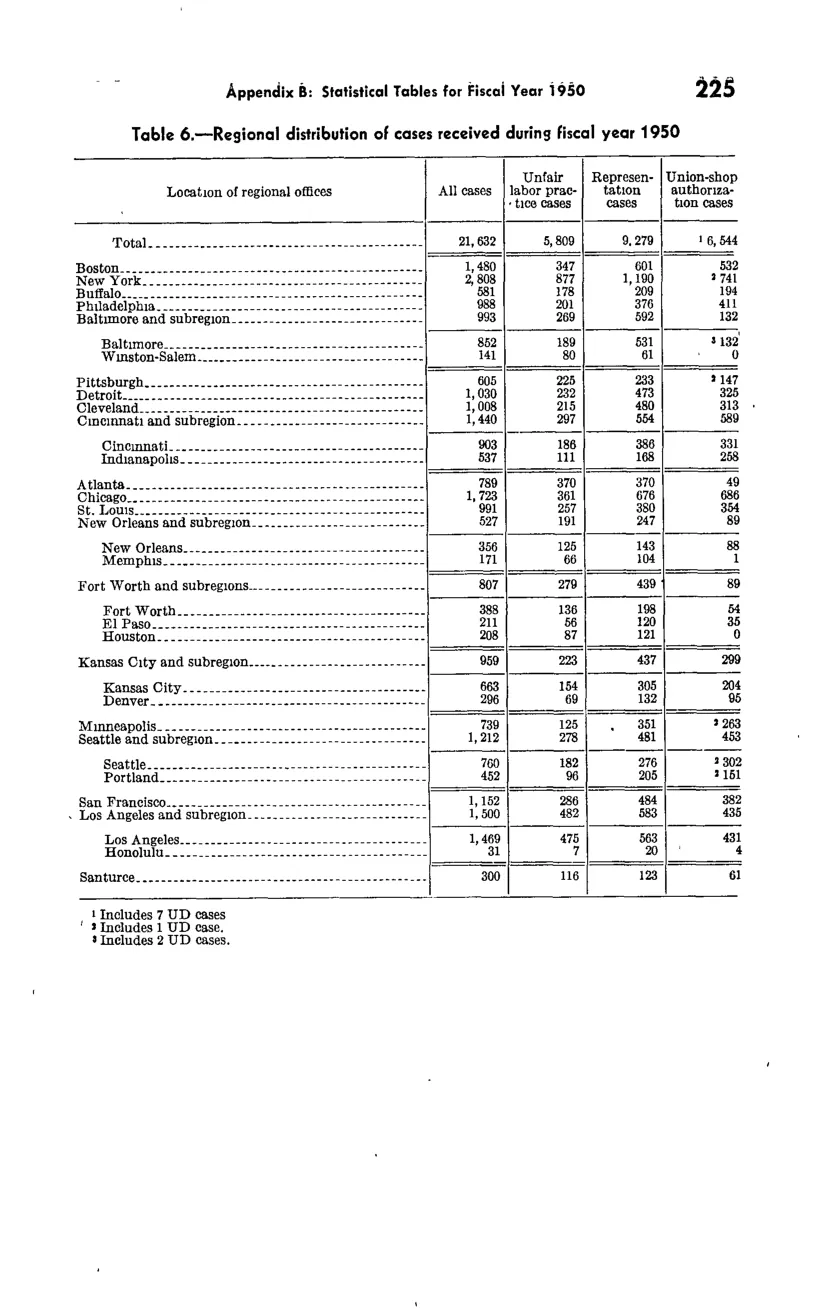
Cases received — by region
| Boston | 1,480 | 347 | 601 | 532 |
|---|---|---|---|---|
| New York | 2,808 | 877 | 1,190 | 2 741 |
| Buffalo | 581 | 178 | 209 | 194 |
| Philadelphia | 988 | 201 | 376 | 411 |
| Baltimore and subregion | 993 | 269 | 592 | 132 |
| Baltimore | 852 | 189 | 531 | , 3 132 |
| Winston-Salem | 141 | 80 | 61 | 0 |
| 225 | 233 | 3 147 | ||
| Pittsburgh | 1,030 | 232 | 473 | 325 |
| Detroit | 605 | |||
| Cleveland | 1,008 | 215 | 480 | 313 |
| Cincinnati and subregion | 1,440 | 297 | 554 | 589 |
| Cincinnati | 903 | 186 | 386 | 331 |
| Indianapolis | 537 | 111 | 168 | 258 |
| Atlanta | 789 | 370 | 370 | 49 |
| Chicago | 1,723 | 361 | 676 | 686 |
| St. Louis | 991 | 257 | 380 | 354 |
| New Orleans and subregion | 527 | 191 | 247 | 89 |
| New Orleans | 356 | 125 | 143 | 88 |
| Memphis | 171 | 66 | 104 | 1 |
| Fort Worth and subregions | 807 | 279 | 439 | 89 |
| Fort Worth | 388 | 136 | 198 | 54 |
| El Paso | 211 | 56 | 120 | 35 |
| Houston | 208 | 87 | 121 | 0 |
| Kansas City and subregion | 959 | 223 | 437 | 299 |
| Kansas City | 663 | 154 | 305 | 204 |
| Denver | 296 | 69 | 132 | 95 |
| Minneapolis | 739 | 125 | , 351 | 2 263 |
| Seattle and subregion | 1,212 | 278 | 481 | 453 |
| Seattle | 760 | 182 | 276 | 2 302 I 161 |
| Portland | 452 | 96 | 205 | |
| San Francisco | 1,152 | 286 | 484 | 382 |
| Los Angeles and subregion | 1,500 | 482 | 583 | 435 |
| Los Angeles | 20 | |||
| 1,460 | 475 | 563 | 431 | |
| Honolulu | 31 | 7 | 4 |
Source image
Source data: U.S. NLRB Annual Reports (public domain). Reconstruction by NLRB Stats Archive. Updated June 2026.