NLRB Stats Archive › Annual Reports › FY1950 › Monthly distribution of cases received during fiscal year 1950
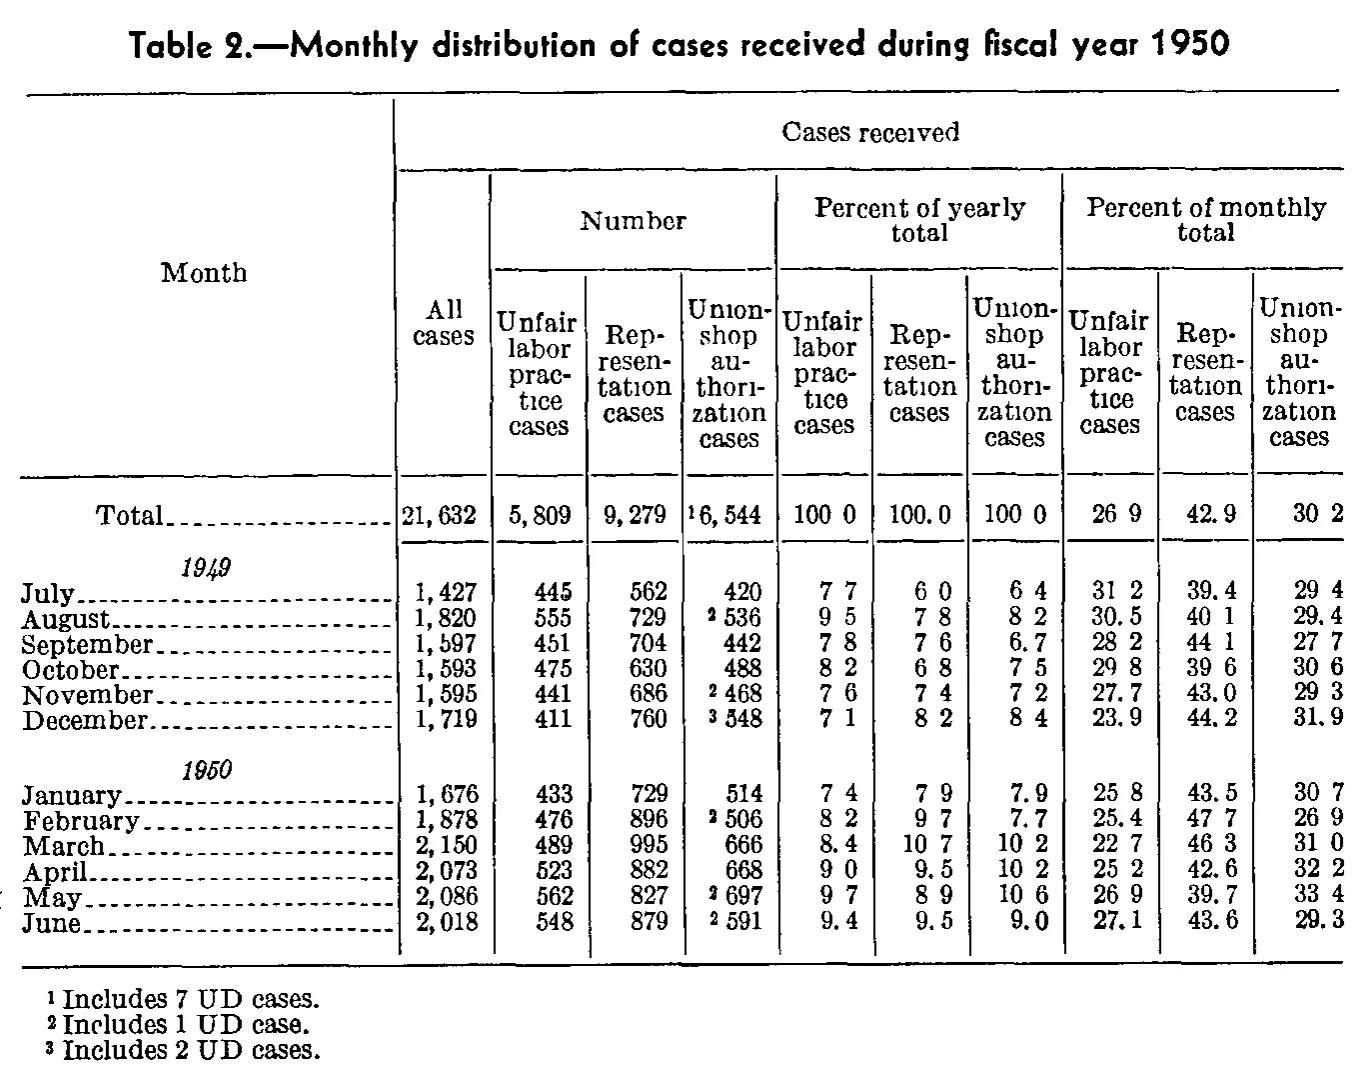
Monthly distribution of cases received during fiscal year 1950
| Month | Cases received | |||||||||
|---|---|---|---|---|---|---|---|---|---|---|
| Month | All cases | Number | Percent of yearly total | Percent of monthly total | ||||||
| Month | All cases | Unfair labor practice cases | Representation cases | Union-shop authorization cases | Unfair labor practice cases | Representation cases | Union-shop authorization cases | Unfair labor practice cases | Representation cases | Union-shop authorization cases |
| Total | 21,632 | 5,809 | 9,279 | 6,544 | 100.0 | 100.0 | 100.0 | 26.9 | 42.9 | 30.2 |
| 1949 | ||||||||||
| July | 1,427 | 445 | 562 | 420 | 7.7 | 6.0 | 6.4 | 31.2 | 39.4 | 29.4 |
| August | 1,820 | 555 | 729 | 536 | 9.5 | 7.8 | 8.2 | 30.5 | 40.1 | 29.4 |
| September | 1,597 | 451 | 704 | 442 | 7.8 | 7.6 | 6.7 | 28.2 | 44.1 | 27.7 |
| October | 1,593 | 475 | 630 | 488 | 8.2 | 6.8 | 7.5 | 29.8 | 39.6 | 30.6 |
| November | 1,595 | 441 | 686 | 468 | 7.6 | 7.4 | 7.2 | 27.7 | 43.0 | 29.3 |
| December | 1,719 | 411 | 760 | 548 | 7.1 | 8.2 | 8.4 | 23.9 | 44.2 | 31.9 |
| 1950 | ||||||||||
| January | 1,676 | 433 | 729 | 514 | 7.4 | 7.9 | 7.9 | 25.8 | 43.5 | 30.7 |
| February | 1,878 | 476 | 896 | 506 | 8.2 | 9.7 | 7.7 | 25.4 | 47.7 | 26.9 |
| March | 2,150 | 489 | 995 | 666 | 8.4 | 10.7 | 10.2 | 22.7 | 46.3 | 31.0 |
| April | 2,073 | 523 | 882 | 668 | 9.0 | 9.5 | 10.2 | 25.2 | 42.6 | 32.2 |
| May | 2,086 | 562 | 827 | 697 | 9.7 | 8.9 | 10.6 | 26.9 | 39.7 | 33.4 |
| June | 2,018 | 548 | 879 | 591 | 9.4 | 9.5 | 9.0 | 27.1 | 43.6 | 29.3 |
- 1 Includes 7 UD cases.
- 2 Includes 1 UD case.
- 3 Includes 2 UD cases.
52 of 52 figures sit in a row or column sum that works out.
Reader’s notes
p. 234. Decimal points: in this scan many decimal points in the percent columns are inked so faintly that they read as a gap (e.g. the Total row prints as \"100 0\", \"100 0\", \"26 9\", \"30 2\"; July as \"7 7\", \"6 0\", \"6 4\", \"31 2\", \"29 4\"). All of these cells are one-decimal percentages set in the same style as the clearly printed neighbours (100.0, 42.9, 39.4), so the decimal point has been restored in every such cell; no digits were altered.\n\nFootnote markers are small raised digits printed immediately BEFORE the figure in the \"Number — Union-shop authorization cases\" column (Total, August, November, December, February, May, June); they are transcribed after the value behind a caret.\n\nThe raised marker on May's union-shop figure (697) is blurred and could be read as either a 2 or a 3. It is given as ^2 because footnote 1 states the annual total includes 7 UD cases, and the monthly markers then sum to exactly 7 (August 1 + November 1 + December 2 + February 1 + May 1 + June 1); reading May as ^3 would give 8.\n\nThe \"1949\" and \"1950\" lines are italic year section headings carrying no values.\n\nSmall internal rounding discrepancies, transcribed as printed, not corrected: April \"Percent of monthly total — Representation cases\" prints 42.6 (882/2,073 = 42.5); May prints 39.7 (827/2,086 = 39.6); June \"Percent of monthly total — Unfair labor practice cases\" prints 27.1 (548/2,018 = 27.2). In each case the printed trio sums to exactly 100.0, so the figures appear to have been forced to the total. All other rows and the Total row reconcile.
Source image
Source data: U.S. NLRB Annual Reports (public domain). Reconstruction by NLRB Stats Archive. Read by claude-opus-5 (effort max, prompt extract_v1) from the 300-dpi scan; stitched by page. Updated October 2026.