NLRB Stats Archive › Annual Reports › FY1949 › Size of establishment in union-shop authorization elections conducted during the fiscal year 1949
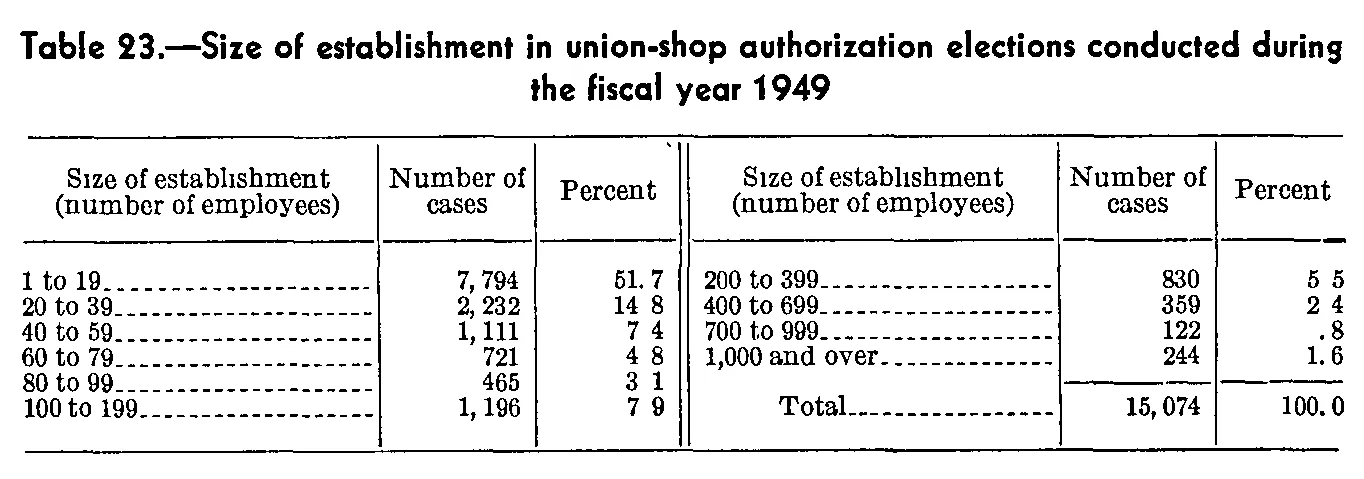
Size of establishment in union-shop authorization elections conducted during the fiscal year 1949
| Size of establishment (number of employees) | Number of cases | Percent |
|---|---|---|
| 1 to 19 | 7,794 | 51.7 |
| 20 to 39 | 2,232 | 14.8 |
| 40 to 59 | 1,111 | 7.4 |
| 60 to 79 | 721 | 4.8 |
| 80 to 99 | 465 | 3.1 |
| 100 to 199 | 1,196 | 7.9 |
| 200 to 399 | 830 | 5.5 |
| 400 to 699 | 359 | 2.4 |
| 700 to 999 | 122 | .8 |
| 1,000 and over | 244 | 1.6 |
| Total | 15,074 | 100.0 |
0 of 11 figures sit in a row or column sum that works out.
Reader’s notes
p. 202. The table is printed as two side-by-side panels with the same three column headings; the right panel's rows (200 to 399 through Total) have been placed under the left panel's rows, and the headings are given once. In the Percent column the decimal points are very faint in this scan and several values look like a space ("14 8", "7 4", "4 8", "3 1", "7 9", "5 5", "2 4"); they are transcribed as decimals (14.8, 7.4, …) because the figures are percentages and sum to exactly 100.0. The ".8" cell for "700 to 999" is printed without a leading zero. The "Number of cases" entries sum to 15,074, matching the printed total.
Source image
Source data: U.S. NLRB Annual Reports (public domain). Reconstruction by NLRB Stats Archive. Read by claude-opus-5 (effort max, prompt extract_v1) from the 300-dpi scan; stitched by page. Updated October 2026.