NLRB Stats Archive › Annual Reports › FY1949 › Geographic distribution of union-shop authorization elections, outcome, eligible voters, and valid votes cast during the fiscal year 1949
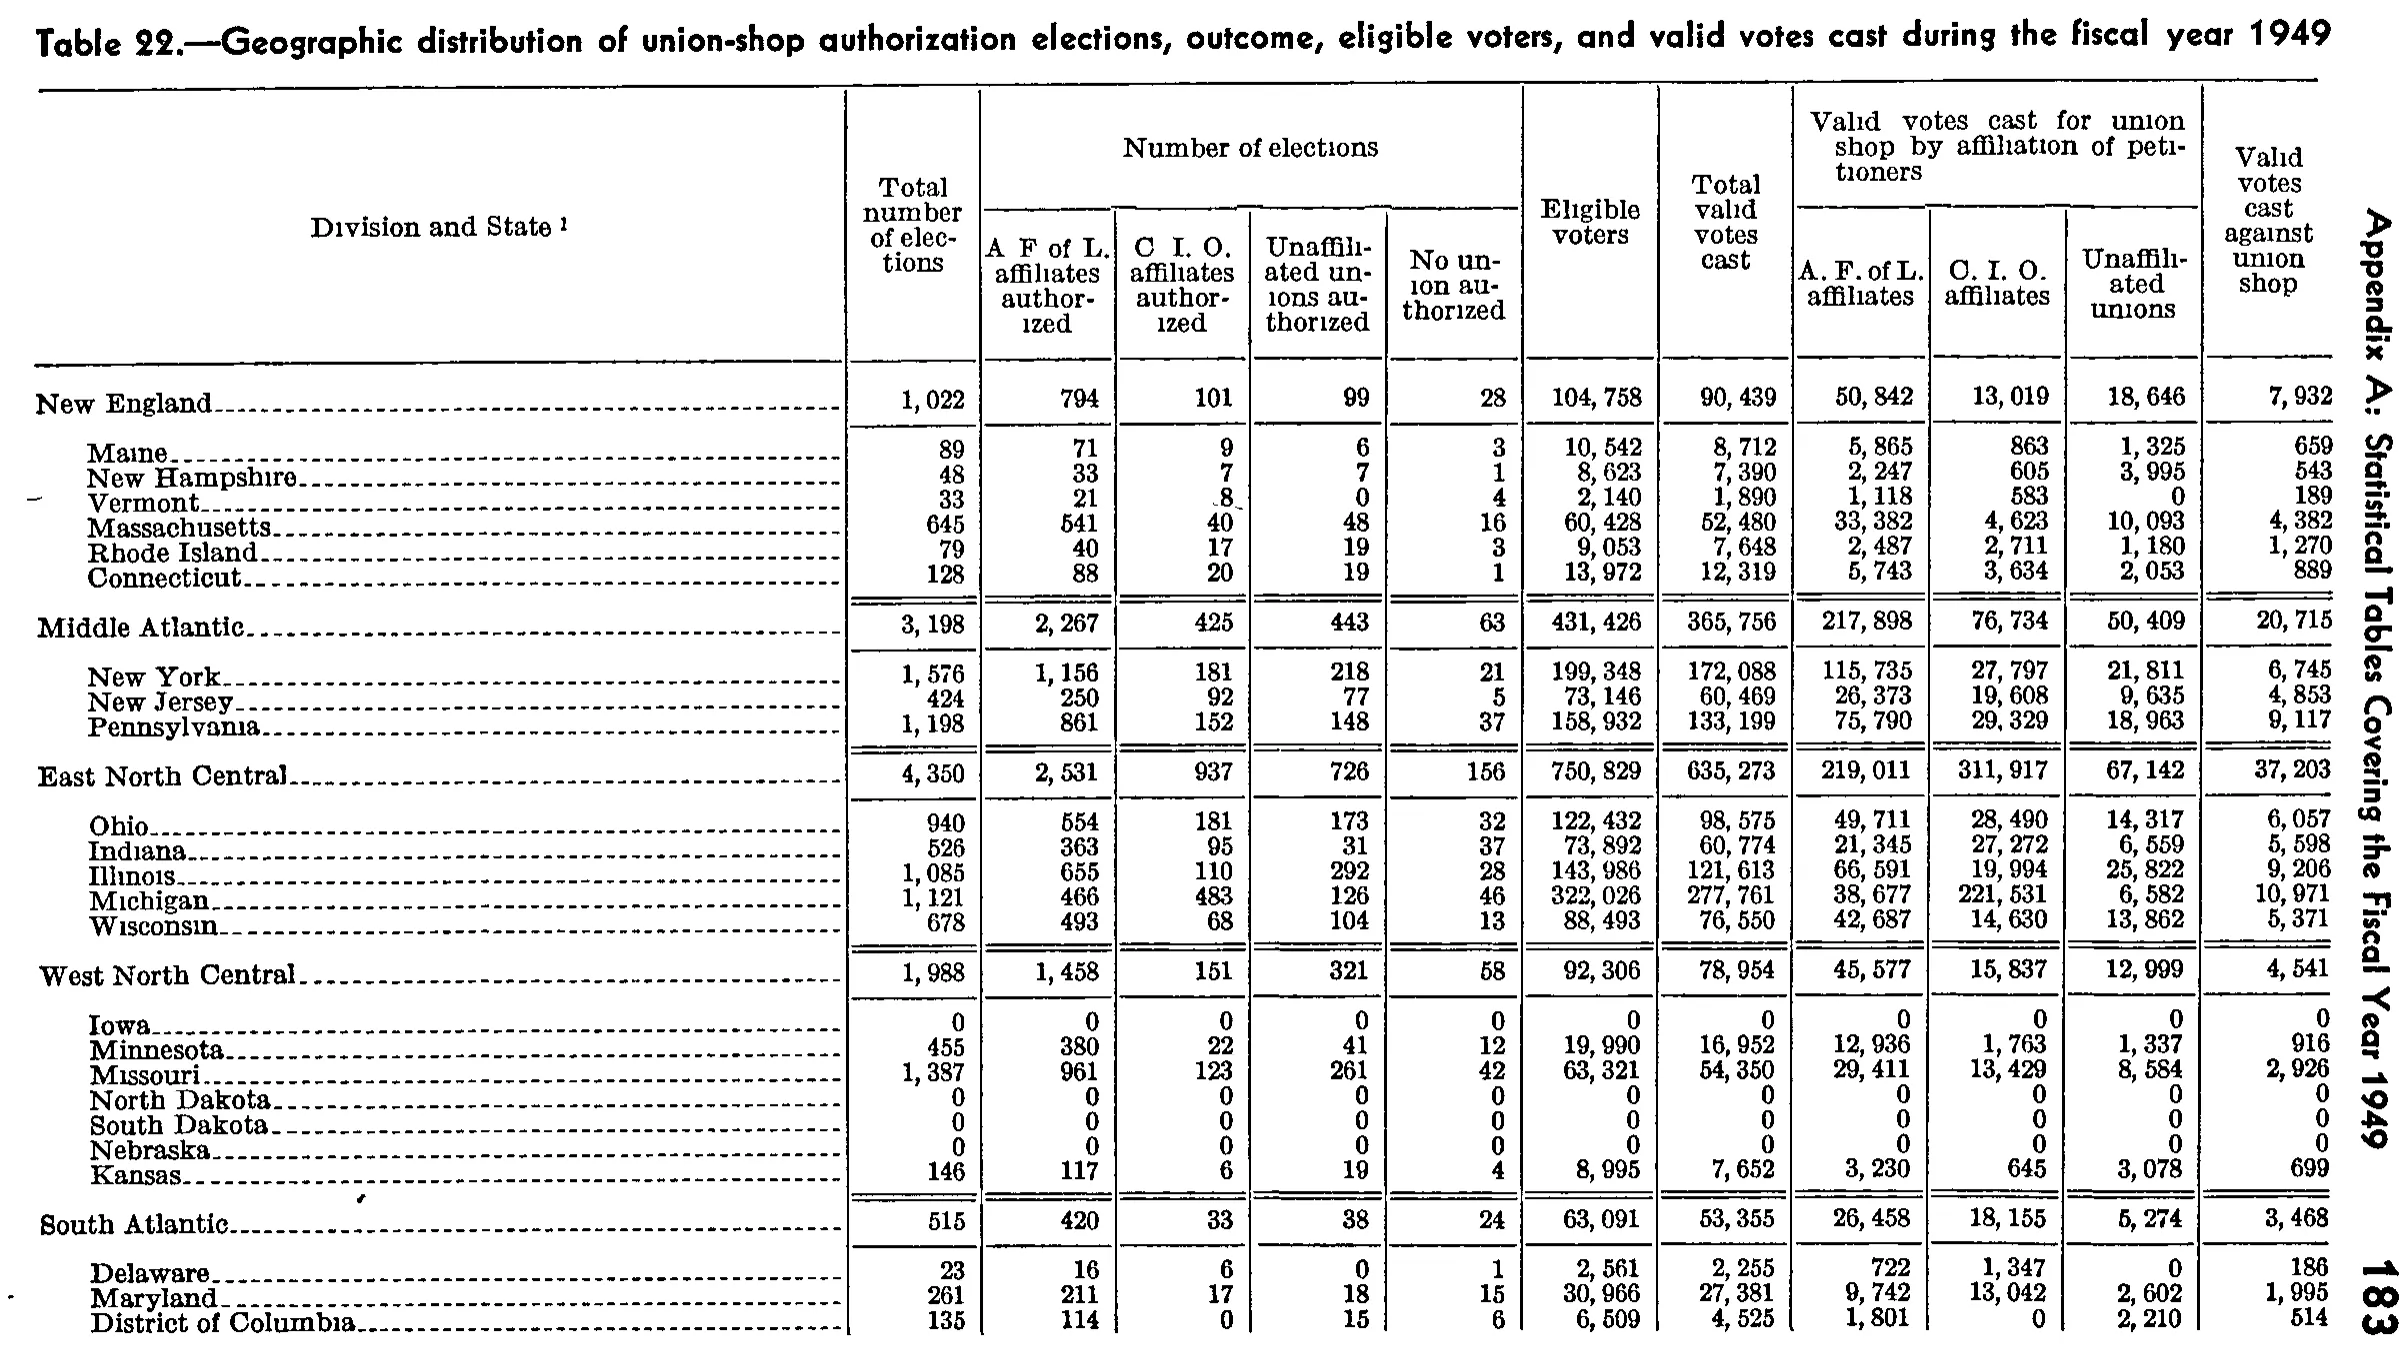
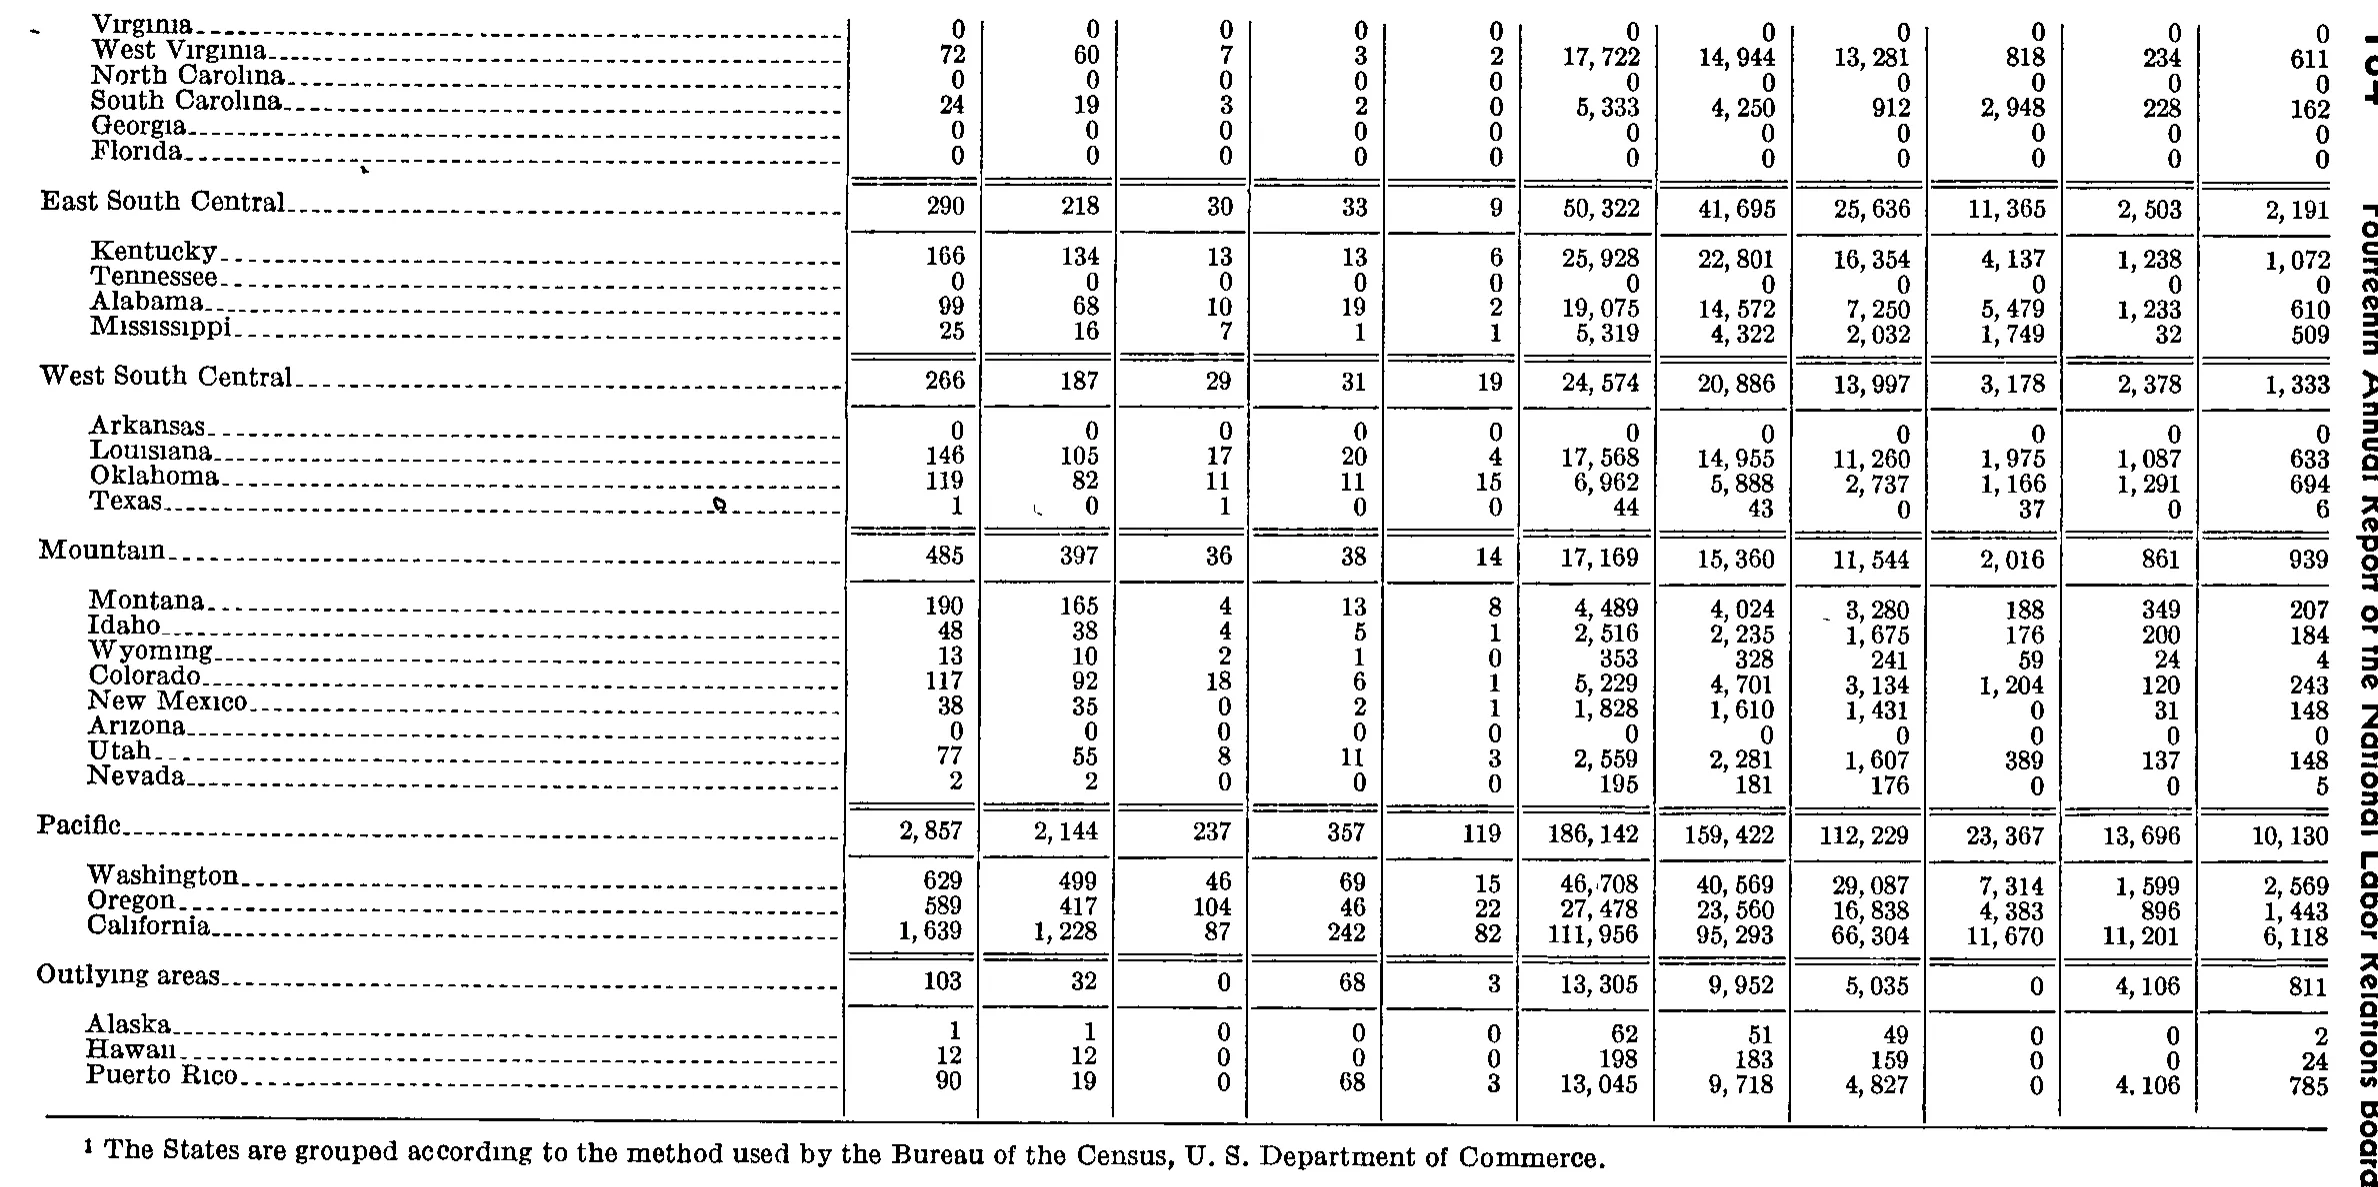
Geographic distribution of union-shop authorization elections, outcome, eligible voters, and valid votes cast during the fiscal year 1949
Stitched from pp. 200–201.
| Division and State | Total number of elections | Number of elections | Eligible voters | Total valid votes cast | Valid votes cast for union shop by affiliation of petitioners | Valid votes cast against union shop | |||||
|---|---|---|---|---|---|---|---|---|---|---|---|
| Division and State | Total number of elections | A. F. of L. affiliates authorized | C. I. O. affiliates authorized | Unaffiliated unions authorized | No union authorized | Eligible voters | Total valid votes cast | A. F. of L. affiliates | C. I. O. affiliates | Unaffiliated unions | Valid votes cast against union shop |
| New England | 1,022 | 794 | 101 | 99 | 28 | 104,758 | 90,439 | 50,842 | 13,019 | 18,646 | 7,932 |
| Maine | 89 | 71 | 9 | 6 | 3 | 10,542 | 8,712 | 5,865 | 863 | 1,325 | 659 |
| New Hampshire | 48 | 33 | 7 | 7 | 1 | 8,623 | 7,390 | 2,247 | 605 | 3,995 | 543 |
| Vermont | 33 | 21 | 8 | 0 | 4 | 2,140 | 1,890 | 1,118 | 583 | 0 | 189 |
| Massachusetts | 645 | 541 | 40 | 48 | 16 | 60,428 | 52,480 | 33,382 | 4,623 | 10,093 | 4,382 |
| Rhode Island | 79 | 40 | 17 | 19 | 3 | 9,053 | 7,648 | 2,487 | 2,711 | 1,180 | 1,270 |
| Connecticut | 128 | 88 | 20 | 19 | 1 | 13,972 | 12,319 | 5,743 | 3,634 | 2,053 | 889 |
| Middle Atlantic | 3,198 | 2,267 | 425 | 443 | 63 | 431,426 | 365,756 | 217,898 | 76,734 | 50,409 | 20,715 |
| New York | 1,576 | 1,156 | 181 | 218 | 21 | 199,348 | 172,088 | 115,735 | 27,797 | 21,811 | 6,745 |
| New Jersey | 424 | 250 | 92 | 77 | 5 | 73,146 | 60,469 | 26,373 | 19,608 | 9,635 | 4,853 |
| Pennsylvania | 1,198 | 861 | 152 | 148 | 37 | 158,932 | 133,199 | 75,790 | 29,329 | 18,963 | 9,117 |
| East North Central | 4,350 | 2,531 | 937 | 726 | 156 | 750,829 | 635,273 | 219,011 | 311,917 | 67,142 | 37,203 |
| Ohio | 940 | 554 | 181 | 173 | 32 | 122,432 | 98,575 | 49,711 | 28,490 | 14,317 | 6,057 |
| Indiana | 526 | 363 | 95 | 31 | 37 | 73,892 | 60,774 | 21,345 | 27,272 | 6,559 | 5,598 |
| Illinois | 1,085 | 655 | 110 | 292 | 28 | 143,986 | 121,613 | 66,591 | 19,994 | 25,822 | 9,206 |
| Michigan | 1,121 | 466 | 483 | 126 | 46 | 322,026 | 277,761 | 38,677 | 221,531 | 6,582 | 10,971 |
| Wisconsin | 678 | 493 | 68 | 104 | 13 | 88,493 | 76,550 | 42,687 | 14,630 | 13,862 | 5,371 |
| West North Central | 1,988 | 1,458 | 151 | 321 | 58 | 92,306 | 78,954 | 45,577 | 15,837 | 12,999 | 4,541 |
| Iowa | 0 | 0 | 0 | 0 | 0 | 0 | 0 | 0 | 0 | 0 | 0 |
| Minnesota | 455 | 380 | 22 | 41 | 12 | 19,990 | 16,952 | 12,936 | 1,763 | 1,337 | 916 |
| Missouri | 1,387 | 961 | 123 | 261 | 42 | 63,321 | 54,350 | 29,411 | 13,429 | 8,584 | 2,926 |
| North Dakota | 0 | 0 | 0 | 0 | 0 | 0 | 0 | 0 | 0 | 0 | 0 |
| South Dakota | 0 | 0 | 0 | 0 | 0 | 0 | 0 | 0 | 0 | 0 | 0 |
| Nebraska | 0 | 0 | 0 | 0 | 0 | 0 | 0 | 0 | 0 | 0 | 0 |
| Kansas | 146 | 117 | 6 | 19 | 4 | 8,995 | 7,652 | 3,230 | 645 | 3,078 | 699 |
| South Atlantic | 515 | 420 | 33 | 38 | 24 | 63,091 | 53,355 | 26,458 | 18,155 | 5,274 | 3,468 |
| Delaware | 23 | 16 | 6 | 0 | 1 | 2,561 | 2,255 | 722 | 1,347 | 0 | 186 |
| Maryland | 261 | 211 | 17 | 18 | 15 | 30,966 | 27,381 | 9,742 | 13,042 | 2,602 | 1,995 |
| District of Columbia | 135 | 114 | 0 | 15 | 6 | 6,509 | 4,525 | 1,801 | 0 | 2,210 | 514 |
| Virginia | 0 | 0 | 0 | 0 | 0 | 0 | 0 | 0 | 0 | 0 | 0 |
| West Virginia | 72 | 60 | 7 | 3 | 2 | 17,722 | 14,944 | 13,281 | 818 | 234 | 611 |
| North Carolina | 0 | 0 | 0 | 0 | 0 | 0 | 0 | 0 | 0 | 0 | 0 |
| South Carolina | 24 | 19 | 3 | 2 | 0 | 5,333 | 4,250 | 912 | 2,948 | 228 | 162 |
| Georgia | 0 | 0 | 0 | 0 | 0 | 0 | 0 | 0 | 0 | 0 | 0 |
| Florida | 0 | 0 | 0 | 0 | 0 | 0 | 0 | 0 | 0 | 0 | 0 |
| East South Central | 290 | 218 | 30 | 33 | 9 | 50,322 | 41,695 | 25,636 | 11,365 | 2,503 | 2,191 |
| Kentucky | 166 | 134 | 13 | 13 | 6 | 25,928 | 22,801 | 16,354 | 4,137 | 1,238 | 1,072 |
| Tennessee | 0 | 0 | 0 | 0 | 0 | 0 | 0 | 0 | 0 | 0 | 0 |
| Alabama | 99 | 68 | 10 | 19 | 2 | 19,075 | 14,572 | 7,250 | 5,479 | 1,233 | 610 |
| Mississippi | 25 | 16 | 7 | 1 | 1 | 5,319 | 4,322 | 2,032 | 1,749 | 32 | 509 |
| West South Central | 266 | 187 | 29 | 31 | 19 | 24,574 | 20,886 | 13,997 | 3,178 | 2,378 | 1,333 |
| Arkansas | 0 | 0 | 0 | 0 | 0 | 0 | 0 | 0 | 0 | 0 | 0 |
| Louisiana | 146 | 105 | 17 | 20 | 4 | 17,568 | 14,955 | 11,260 | 1,975 | 1,087 | 633 |
| Oklahoma | 119 | 82 | 11 | 11 | 15 | 6,962 | 5,888 | 2,737 | 1,166 | 1,291 | 694 |
| Texas | 1 | 0 | 1 | 0 | 0 | 44 | 43 | 0 | 37 | 0 | 6 |
| Mountain | 485 | 397 | 36 | 38 | 14 | 17,169 | 15,360 | 11,544 | 2,016 | 861 | 939 |
| Montana | 190 | 165 | 4 | 13 | 8 | 4,489 | 4,024 | 3,280 | 188 | 349 | 207 |
| Idaho | 48 | 38 | 4 | 5 | 1 | 2,516 | 2,235 | 1,675 | 176 | 200 | 184 |
| Wyoming | 13 | 10 | 2 | 1 | 0 | 353 | 328 | 241 | 59 | 24 | 4 |
| Colorado | 117 | 92 | 18 | 6 | 1 | 5,229 | 4,701 | 3,134 | 1,204 | 120 | 243 |
| New Mexico | 38 | 35 | 0 | 2 | 1 | 1,828 | 1,610 | 1,431 | 0 | 31 | 148 |
| Arizona | 0 | 0 | 0 | 0 | 0 | 0 | 0 | 0 | 0 | 0 | 0 |
| Utah | 77 | 55 | 8 | 11 | 3 | 2,559 | 2,281 | 1,607 | 389 | 137 | 148 |
| Nevada | 2 | 2 | 0 | 0 | 0 | 195 | 181 | 176 | 0 | 0 | 5 |
| Pacific | 2,857 | 2,144 | 237 | 357 | 119 | 186,142 | 159,422 | 112,229 | 23,367 | 13,696 | 10,130 |
| Washington | 629 | 499 | 46 | 69 | 15 | 46,708 | 40,569 | 29,087 | 7,314 | 1,599 | 2,569 |
| Oregon | 589 | 417 | 104 | 46 | 22 | 27,478 | 23,560 | 16,838 | 4,383 | 896 | 1,443 |
| California | 1,639 | 1,228 | 87 | 242 | 82 | 111,956 | 95,293 | 66,304 | 11,670 | 11,201 | 6,118 |
| Outlying areas | 103 | 32 | 0 | 68 | 3 | 13,305 | 9,952 | 5,035 | 0 | 4,106 | 811 |
| Alaska | 1 | 1 | 0 | 0 | 0 | 62 | 51 | 49 | 0 | 0 | 2 |
| Hawaii | 12 | 12 | 0 | 0 | 0 | 198 | 183 | 159 | 0 | 0 | 24 |
| Puerto Rico | 90 | 19 | 0 | 68 | 3 | 13,045 | 9,718 | 4,827 | 0 | 4,106 | 785 |
- 1 The States are grouped according to the method used by the Bureau of the Census, U. S. Department of Commerce.
527 of 527 figures sit in a row or column sum that works out.
Reader’s notes
p. 200. The crop is cut off at the bottom of the page: the table continues beyond "District of Columbia" (the South Atlantic division's remaining states and the later divisions are on the following page), and the text of footnote 1 (marker printed on the stub heading "Division and State") is not visible on this image, so `footnotes` is empty. 12 columns: stub, "Total number of elections", four columns under "Number of elections", "Eligible voters", "Total valid votes cast", three columns under "Valid votes cast for union shop by affiliation of petitioners", and "Valid votes cast against union shop". Heading punctuation: in the two "Number of elections" sub-headings the scan renders the abbreviations with faint/dropped periods ("A F of L." and "C I O."), while the same abbreviations in the "Valid votes cast for union shop" panel clearly read "A. F. of L." and "C. I. O."; I transcribed all four consistently with full periods, taking the missing dots as scan dropout. The division rows (New England, Middle Atlantic, East North Central, West North Central, South Atlantic) are totals for the states listed beneath them. All division totals that are complete on this crop add up exactly across every one of the 11 numeric columns, which supports the digit reading; South Atlantic is not verifiable here because its state list is truncated. Rows for Iowa, North Dakota, South Dakota and Nebraska are printed as zeros in every column (printed "0", not blanks or dashes). Vermont's "Unaffiliated unions authorized" and "Unaffiliated unions" (votes) cells and Delaware's "Unaffiliated unions authorized" and "Unaffiliated unions" cells are likewise printed zeros, as is District of Columbia's "C. I. O. affiliates" in both the elections and the votes panels.
p. 201. The crop is a continuation page: no column headings are printed, so header_rows is empty. The grid is 12 columns (stub + 11 numeric columns), confirmed by the column rules and by every row carrying 11 values. The crop begins in the middle of a region section (Virginia ... Florida); that section's label and subtotal line (South Atlantic) fall on the previous page, as do the earlier States. In this table's layout each region subtotal line is printed above its member States, which are set in an indented block. Several State rows are printed as all zeros (Virginia, North Carolina, Georgia, Florida, Tennessee, Arkansas, Arizona). These are transcribed as printed and are not scanning damage: every region subtotal on the page reproduces exactly when its member States are added, including the zero rows (e.g. East South Central 290 = 166 + 0 + 99 + 25; West South Central 266 = 0 + 146 + 119 + 1; Mountain, Pacific and Outlying areas also reconcile in all 11 columns). Minor scan artifacts, none affecting a digit: a small stray ink mark sits in the leader dots of the Texas row and another just left of its second-column 0; a short stray dash appears immediately before Montana's 3,280 (column 8) and is not a minus sign or footnote marker. South Carolina's columns 8 and 9 read 912 and 2,948, an order (col. 8 smaller than col. 9) that is unusual for this table but is clearly printed; it cannot be cross-checked here because the South Atlantic subtotal is off-crop. The vertical running head ("Fourteenth Annual Report of the National Labor Relations Board") and the page number at the right edge were excluded.
Source image
Source data: U.S. NLRB Annual Reports (public domain). Reconstruction by NLRB Stats Archive. Read by claude-opus-5 (effort max, prompt extract_v1) from the 300-dpi scan; stitched by page. Updated October 2026.