NLRB Stats Archive › Annual Reports › FY1949 › Geographic distribution of decertification elections, eligible voters, and number of votes cast for participating unions, during the fiscal year 1949
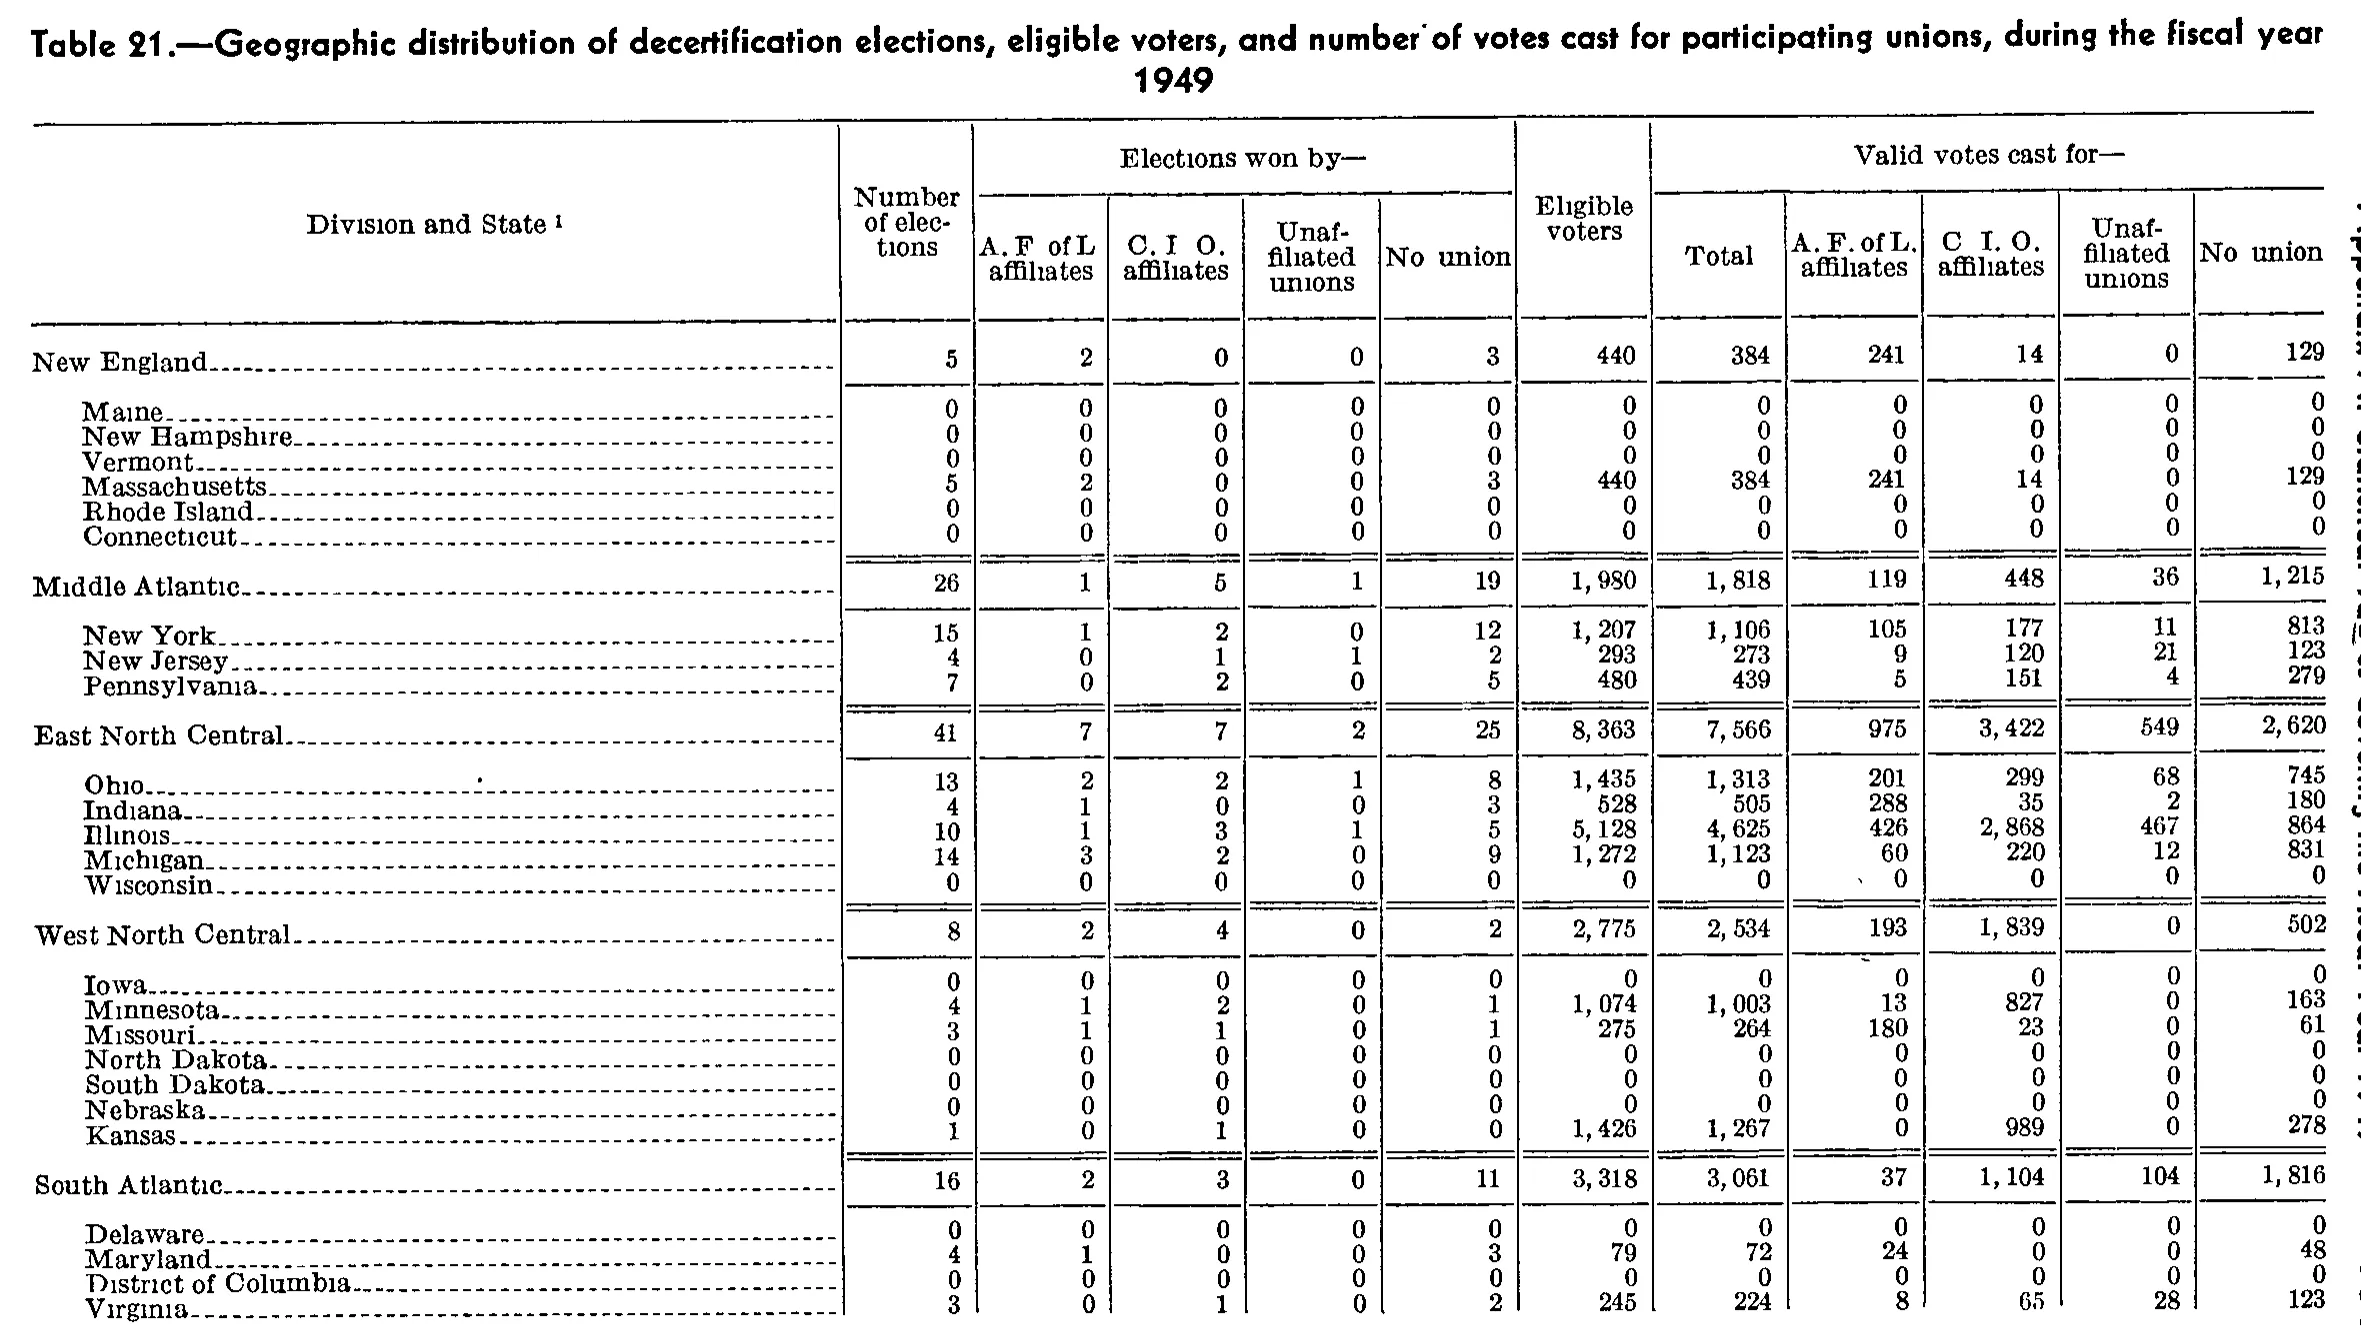
Geographic distribution of decertification elections, eligible voters, and number of votes cast for participating unions, during the fiscal year 1949
Stitched from pp. 198–199.
| Division and State | Number of elections | Elections won by— | Eligible voters | Valid votes cast for— | |||||||
|---|---|---|---|---|---|---|---|---|---|---|---|
| Division and State | Number of elections | A. F. of L. affiliates | C. I. O. affiliates | Unaffiliated unions | No union | Eligible voters | Total | A. F. of L. affiliates | C. I. O. affiliates | Unaffiliated unions | No union |
| New England | 5 | 2 | 0 | 0 | 3 | 440 | 384 | 241 | 14 | 0 | 129 |
| Maine | 0 | 0 | 0 | 0 | 0 | 0 | 0 | 0 | 0 | 0 | 0 |
| New Hampshire | 0 | 0 | 0 | 0 | 0 | 0 | 0 | 0 | 0 | 0 | 0 |
| Vermont | 0 | 0 | 0 | 0 | 0 | 0 | 0 | 0 | 0 | 0 | 0 |
| Massachusetts | 5 | 2 | 0 | 0 | 3 | 440 | 384 | 241 | 14 | 0 | 129 |
| Rhode Island | 0 | 0 | 0 | 0 | 0 | 0 | 0 | 0 | 0 | 0 | 0 |
| Connecticut | 0 | 0 | 0 | 0 | 0 | 0 | 0 | 0 | 0 | 0 | 0 |
| Middle Atlantic | 26 | 1 | 5 | 1 | 19 | 1,980 | 1,818 | 119 | 448 | 36 | 1,215 |
| New York | 15 | 1 | 2 | 0 | 12 | 1,207 | 1,106 | 105 | 177 | 11 | 813 |
| New Jersey | 4 | 0 | 1 | 1 | 2 | 293 | 273 | 9 | 120 | 21 | 123 |
| Pennsylvania | 7 | 0 | 2 | 0 | 5 | 480 | 439 | 5 | 151 | 4 | 279 |
| East North Central | 41 | 7 | 7 | 2 | 25 | 8,363 | 7,566 | 975 | 3,422 | 549 | 2,620 |
| Ohio | 13 | 2 | 2 | 1 | 8 | 1,435 | 1,313 | 201 | 299 | 68 | 745 |
| Indiana | 4 | 1 | 0 | 0 | 3 | 528 | 505 | 288 | 35 | 2 | 180 |
| Illinois | 10 | 1 | 3 | 1 | 5 | 5,128 | 4,625 | 426 | 2,868 | 467 | 864 |
| Michigan | 14 | 3 | 2 | 0 | 9 | 1,272 | 1,123 | 60 | 220 | 12 | 831 |
| Wisconsin | 0 | 0 | 0 | 0 | 0 | 0 | 0 | 0 | 0 | 0 | 0 |
| West North Central | 8 | 2 | 4 | 0 | 2 | 2,775 | 2,534 | 193 | 1,839 | 0 | 502 |
| Iowa | 0 | 0 | 0 | 0 | 0 | 0 | 0 | 0 | 0 | 0 | 0 |
| Minnesota | 4 | 1 | 2 | 0 | 1 | 1,074 | 1,003 | 13 | 827 | 0 | 163 |
| Missouri | 3 | 1 | 1 | 0 | 1 | 275 | 264 | 180 | 23 | 0 | 61 |
| North Dakota | 0 | 0 | 0 | 0 | 0 | 0 | 0 | 0 | 0 | 0 | 0 |
| South Dakota | 0 | 0 | 0 | 0 | 0 | 0 | 0 | 0 | 0 | 0 | 0 |
| Nebraska | 0 | 0 | 0 | 0 | 0 | 0 | 0 | 0 | 0 | 0 | 0 |
| Kansas | 1 | 0 | 1 | 0 | 0 | 1,426 | 1,267 | 0 | 989 | 0 | 278 |
| South Atlantic | 16 | 2 | 3 | 0 | 11 | 3,318 | 3,061 | 37 | 1,104 | 104 | 1,816 |
| Delaware | 0 | 0 | 0 | 0 | 0 | 0 | 0 | 0 | 0 | 0 | 0 |
| Maryland | 4 | 1 | 0 | 0 | 3 | 79 | 72 | 24 | 0 | 0 | 48 |
| District of Columbia | 0 | 0 | 0 | 0 | 0 | 0 | 0 | 0 | 0 | 0 | 0 |
| Virginia | 3 | 0 | 1 | 0 | 2 | 245 | 224 | 8 | 65 | 28 | 123 |
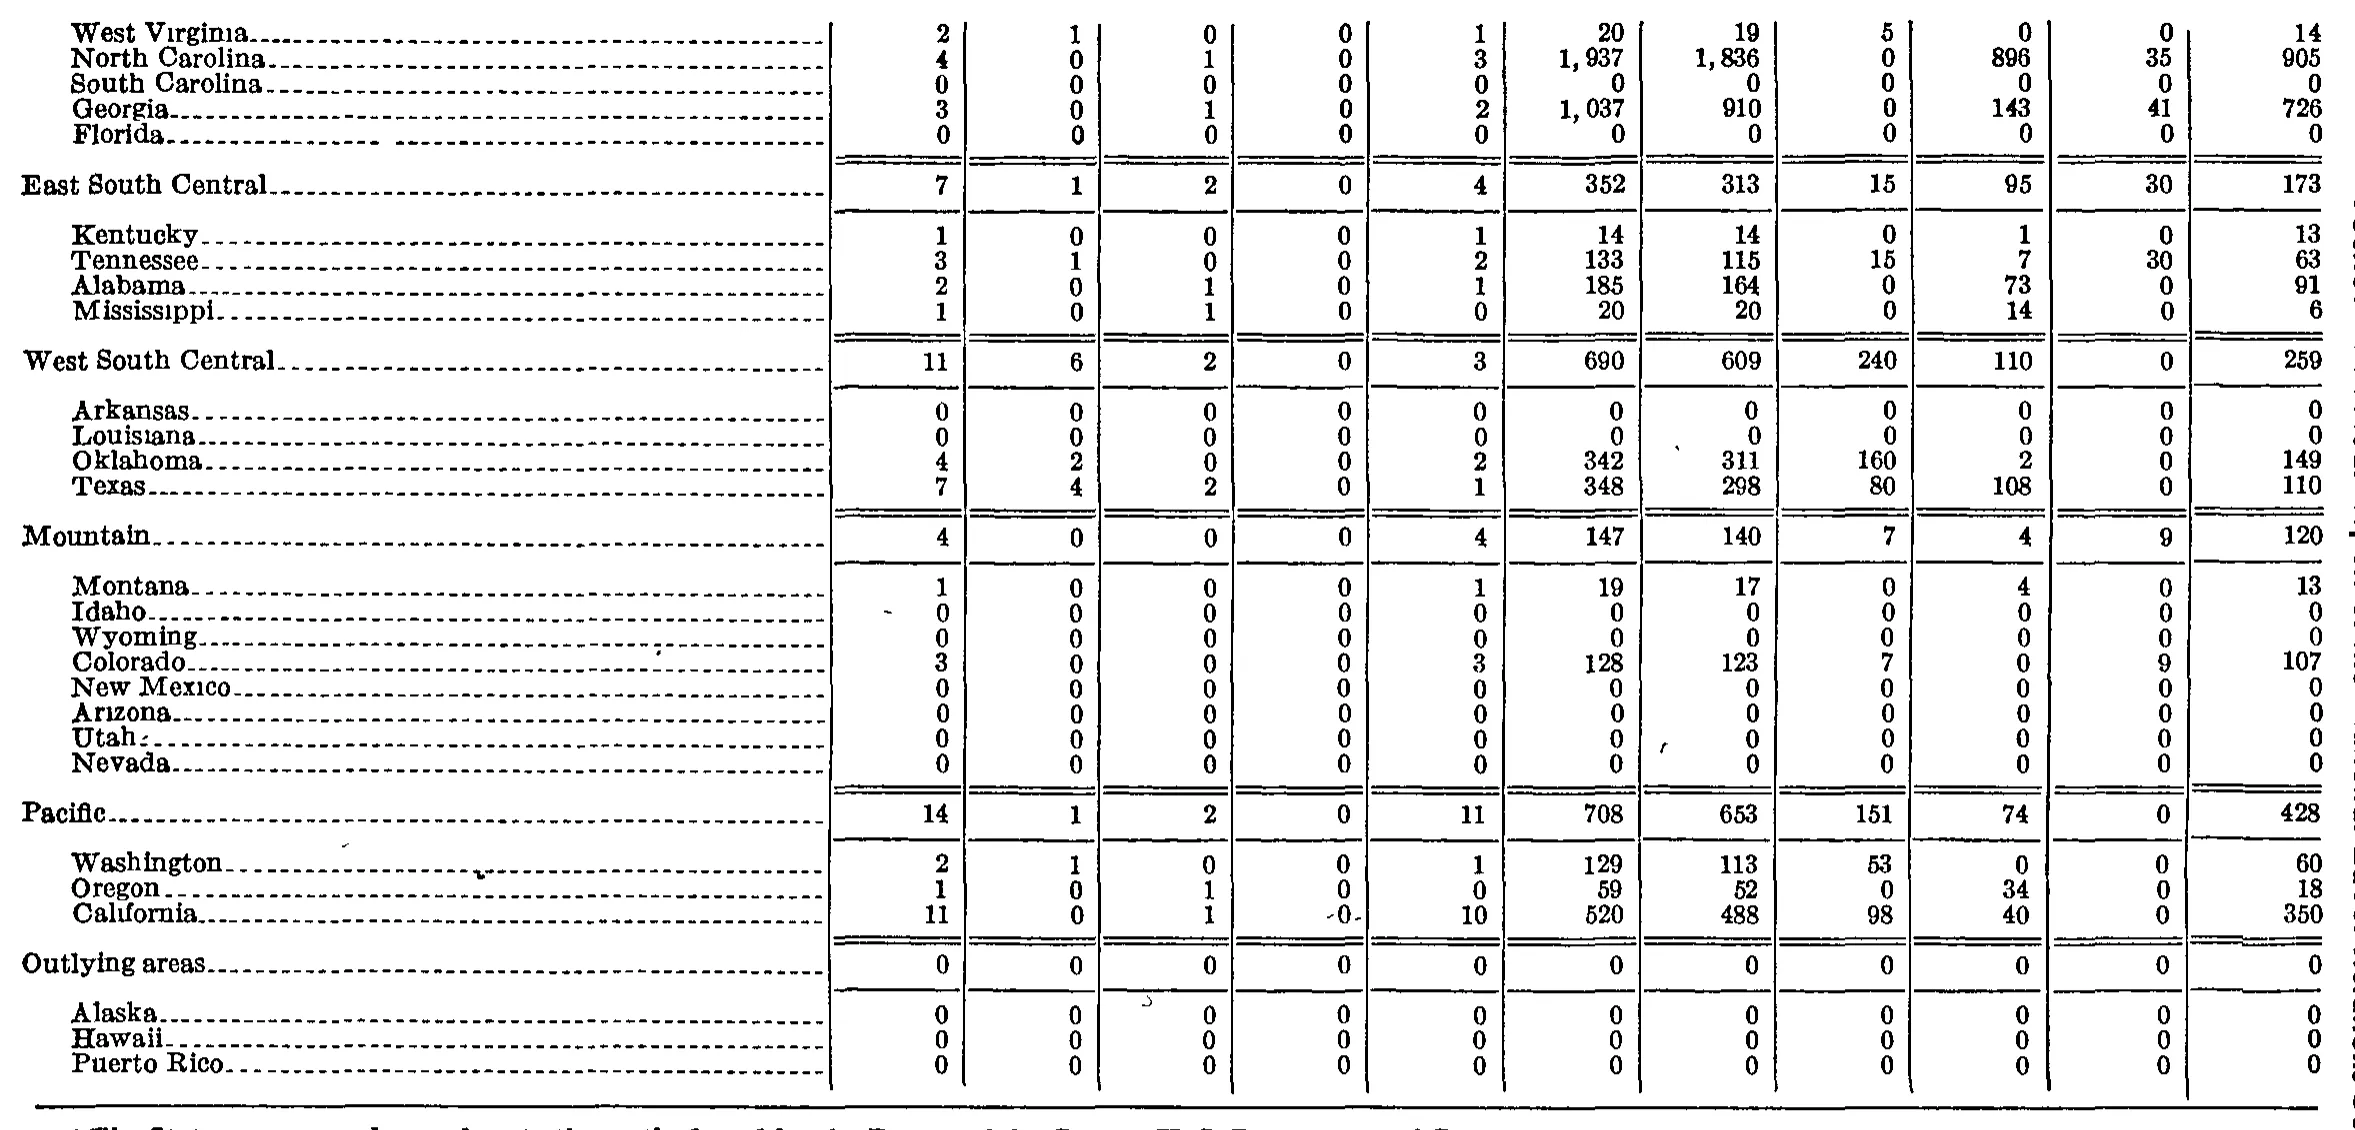
| West Virginia | 2 | 1 | 0 | 0 | 1 | 20 | 19 | 5 | 0 | 0 | 14 |
| North Carolina | 4 | 0 | 1 | 0 | 3 | 1,937 | 1,836 | 0 | 896 | 35 | 905 |
| South Carolina | 0 | 0 | 0 | 0 | 0 | 0 | 0 | 0 | 0 | 0 | 0 |
| Georgia | 3 | 0 | 1 | 0 | 2 | 1,037 | 910 | 0 | 143 | 41 | 726 |
| Florida | 0 | 0 | 0 | 0 | 0 | 0 | 0 | 0 | 0 | 0 | 0 |
| East South Central | 7 | 1 | 2 | 0 | 4 | 352 | 313 | 15 | 95 | 30 | 173 |
| Kentucky | 1 | 0 | 0 | 0 | 1 | 14 | 14 | 0 | 1 | 0 | 13 |
| Tennessee | 3 | 1 | 0 | 0 | 2 | 133 | 115 | 15 | 7 | 30 | 63 |
| Alabama | 2 | 0 | 1 | 0 | 1 | 185 | 164 | 0 | 73 | 0 | 91 |
| Mississippi | 1 | 0 | 1 | 0 | 0 | 20 | 20 | 0 | 14 | 0 | 6 |
| West South Central | 11 | 6 | 2 | 0 | 3 | 690 | 609 | 240 | 110 | 0 | 259 |
| Arkansas | 0 | 0 | 0 | 0 | 0 | 0 | 0 | 0 | 0 | 0 | 0 |
| Louisiana | 0 | 0 | 0 | 0 | 0 | 0 | 0 | 0 | 0 | 0 | 0 |
| Oklahoma | 4 | 2 | 0 | 0 | 2 | 342 | 311 | 160 | 2 | 0 | 149 |
| Texas | 7 | 4 | 2 | 0 | 1 | 348 | 298 | 80 | 108 | 0 | 110 |
| Mountain | 4 | 0 | 0 | 0 | 4 | 147 | 140 | 7 | 4 | 9 | 120 |
| Montana | 1 | 0 | 0 | 0 | 1 | 19 | 17 | 0 | 4 | 0 | 13 |
| Idaho | 0 | 0 | 0 | 0 | 0 | 0 | 0 | 0 | 0 | 0 | 0 |
| Wyoming | 0 | 0 | 0 | 0 | 0 | 0 | 0 | 0 | 0 | 0 | 0 |
| Colorado | 3 | 0 | 0 | 0 | 3 | 128 | 123 | 7 | 0 | 9 | 107 |
| New Mexico | 0 | 0 | 0 | 0 | 0 | 0 | 0 | 0 | 0 | 0 | 0 |
| Arizona | 0 | 0 | 0 | 0 | 0 | 0 | 0 | 0 | 0 | 0 | 0 |
| Utah | 0 | 0 | 0 | 0 | 0 | 0 | 0 | 0 | 0 | 0 | 0 |
| Nevada | 0 | 0 | 0 | 0 | 0 | 0 | 0 | 0 | 0 | 0 | 0 |
| Pacific | 14 | 1 | 2 | 0 | 11 | 708 | 653 | 151 | 74 | 0 | 428 |
| Washington | 2 | 1 | 0 | 0 | 1 | 129 | 113 | 53 | 0 | 0 | 60 |
| Oregon | 1 | 0 | 1 | 0 | 0 | 59 | 52 | 0 | 34 | 0 | 18 |
| California | 11 | 0 | 1 | 0 | 10 | 520 | 488 | 98 | 40 | 0 | 350 |
| Outlying areas | 0 | 0 | 0 | 0 | 0 | 0 | 0 | 0 | 0 | 0 | 0 |
| Alaska | 0 | 0 | 0 | 0 | 0 | 0 | 0 | 0 | 0 | 0 | 0 |
| Hawaii | 0 | 0 | 0 | 0 | 0 | 0 | 0 | 0 | 0 | 0 | 0 |
| Puerto Rico | 0 | 0 | 0 | 0 | 0 | 0 | 0 | 0 | 0 | 0 | 0 |
305 of 305 figures sit in a row or column sum that works out.
Reader’s notes
p. 198. The crop ends mid-table: the body is cut off immediately after the "Virginia" row (the rest of the South Atlantic division and all later divisions continue on the next page/crop), and the text of footnote 1, keyed to the stub heading "Division and State ^1", falls below the crop, so `footnotes` is empty. Column structure: 12 columns — stub, "Number of elections", four columns under the spanner "Elections won by—", "Eligible voters", and five columns under the spanner "Valid votes cast for—". Heading punctuation: in the "Elections won by—" group the A.F. of L. heading is printed with faint/dropped periods (it reads roughly "A. F of L affiliates" in the scan) while the same heading in the "Valid votes cast for—" group reads "A. F. of L. affiliates"; I have normalized both to "A. F. of L. affiliates", since this is almost certainly scan dropout rather than a genuine difference. Every row's components sum correctly to its printed totals and every division line equals the sum of its States, so no misprints are suspected. A narrow strip of rotated running-head text is visible along the right edge of the image, outside the table's right rule; it is not a data column and has been omitted.
p. 199. Continuation page: no column headings are printed on this crop, so header_rows is empty. The grid is 12 columns wide (stub + 11 numeric columns), counted from the column rules. The first five rows (West Virginia through Florida) are the tail of a region block (South Atlantic) whose heading and earlier states fall on the preceding page; the region subtotal line for that block is not on this crop. The region rows printed here (East South Central, West South Central, Mountain, Pacific, Outlying areas) are subtotal lines, each followed by its indented member states/territories. A footnote line is printed below the table rule at the very bottom of the crop, but it is sliced horizontally by the crop: only the top sliver of the letters survives, so it cannot be read reliably and is not reconstructed here. footnotes is therefore empty even though at least one footnote exists on the page. Doubtful/odd cells: - California, column 4: the figure is printed as a 0 flanked by stray dash marks ("-0-"); the surrounding rows all print a plain 0 and the column is 0 throughout this page, so it is transcribed as 0. The dashes appear to be scan noise picked up from the leader-dot rule. - Several stray specks sit between columns (notably beside Oklahoma col 6, Utah col 7, Idaho col 1, and in the Alaska row near col 3); none are digits or footnote markers and none were transcribed. - Row labels "West Virginia", "Mississippi", "Louisiana", "Arizona" and "Utah" show broken/filled dotting on the terminal letters from the scan, but all are legible. - The far right edge of the image carries sideways running text from the facing page, outside the table's last column rule; it is not part of the table. No footnote markers are attached to any value, label or heading on this crop. Arithmetic cross-checks all hold as printed: in every row col 1 = cols 2+3+4+5 and col 7 = cols 8+9+10+11, and each region subtotal equals the sum of its member states in every column. Nothing was computed or corrected.
Source image
Source data: U.S. NLRB Annual Reports (public domain). Reconstruction by NLRB Stats Archive. Read by claude-opus-5 (effort max, prompt extract_v1) from the 300-dpi scan; stitched by page. Updated October 2026.