NLRB Stats Archive › Annual Reports › FY1949 › Industrial distribution of union-shop authorization elections, outcome, eligible voters, and valid votes cast, during the fiscal year 1949
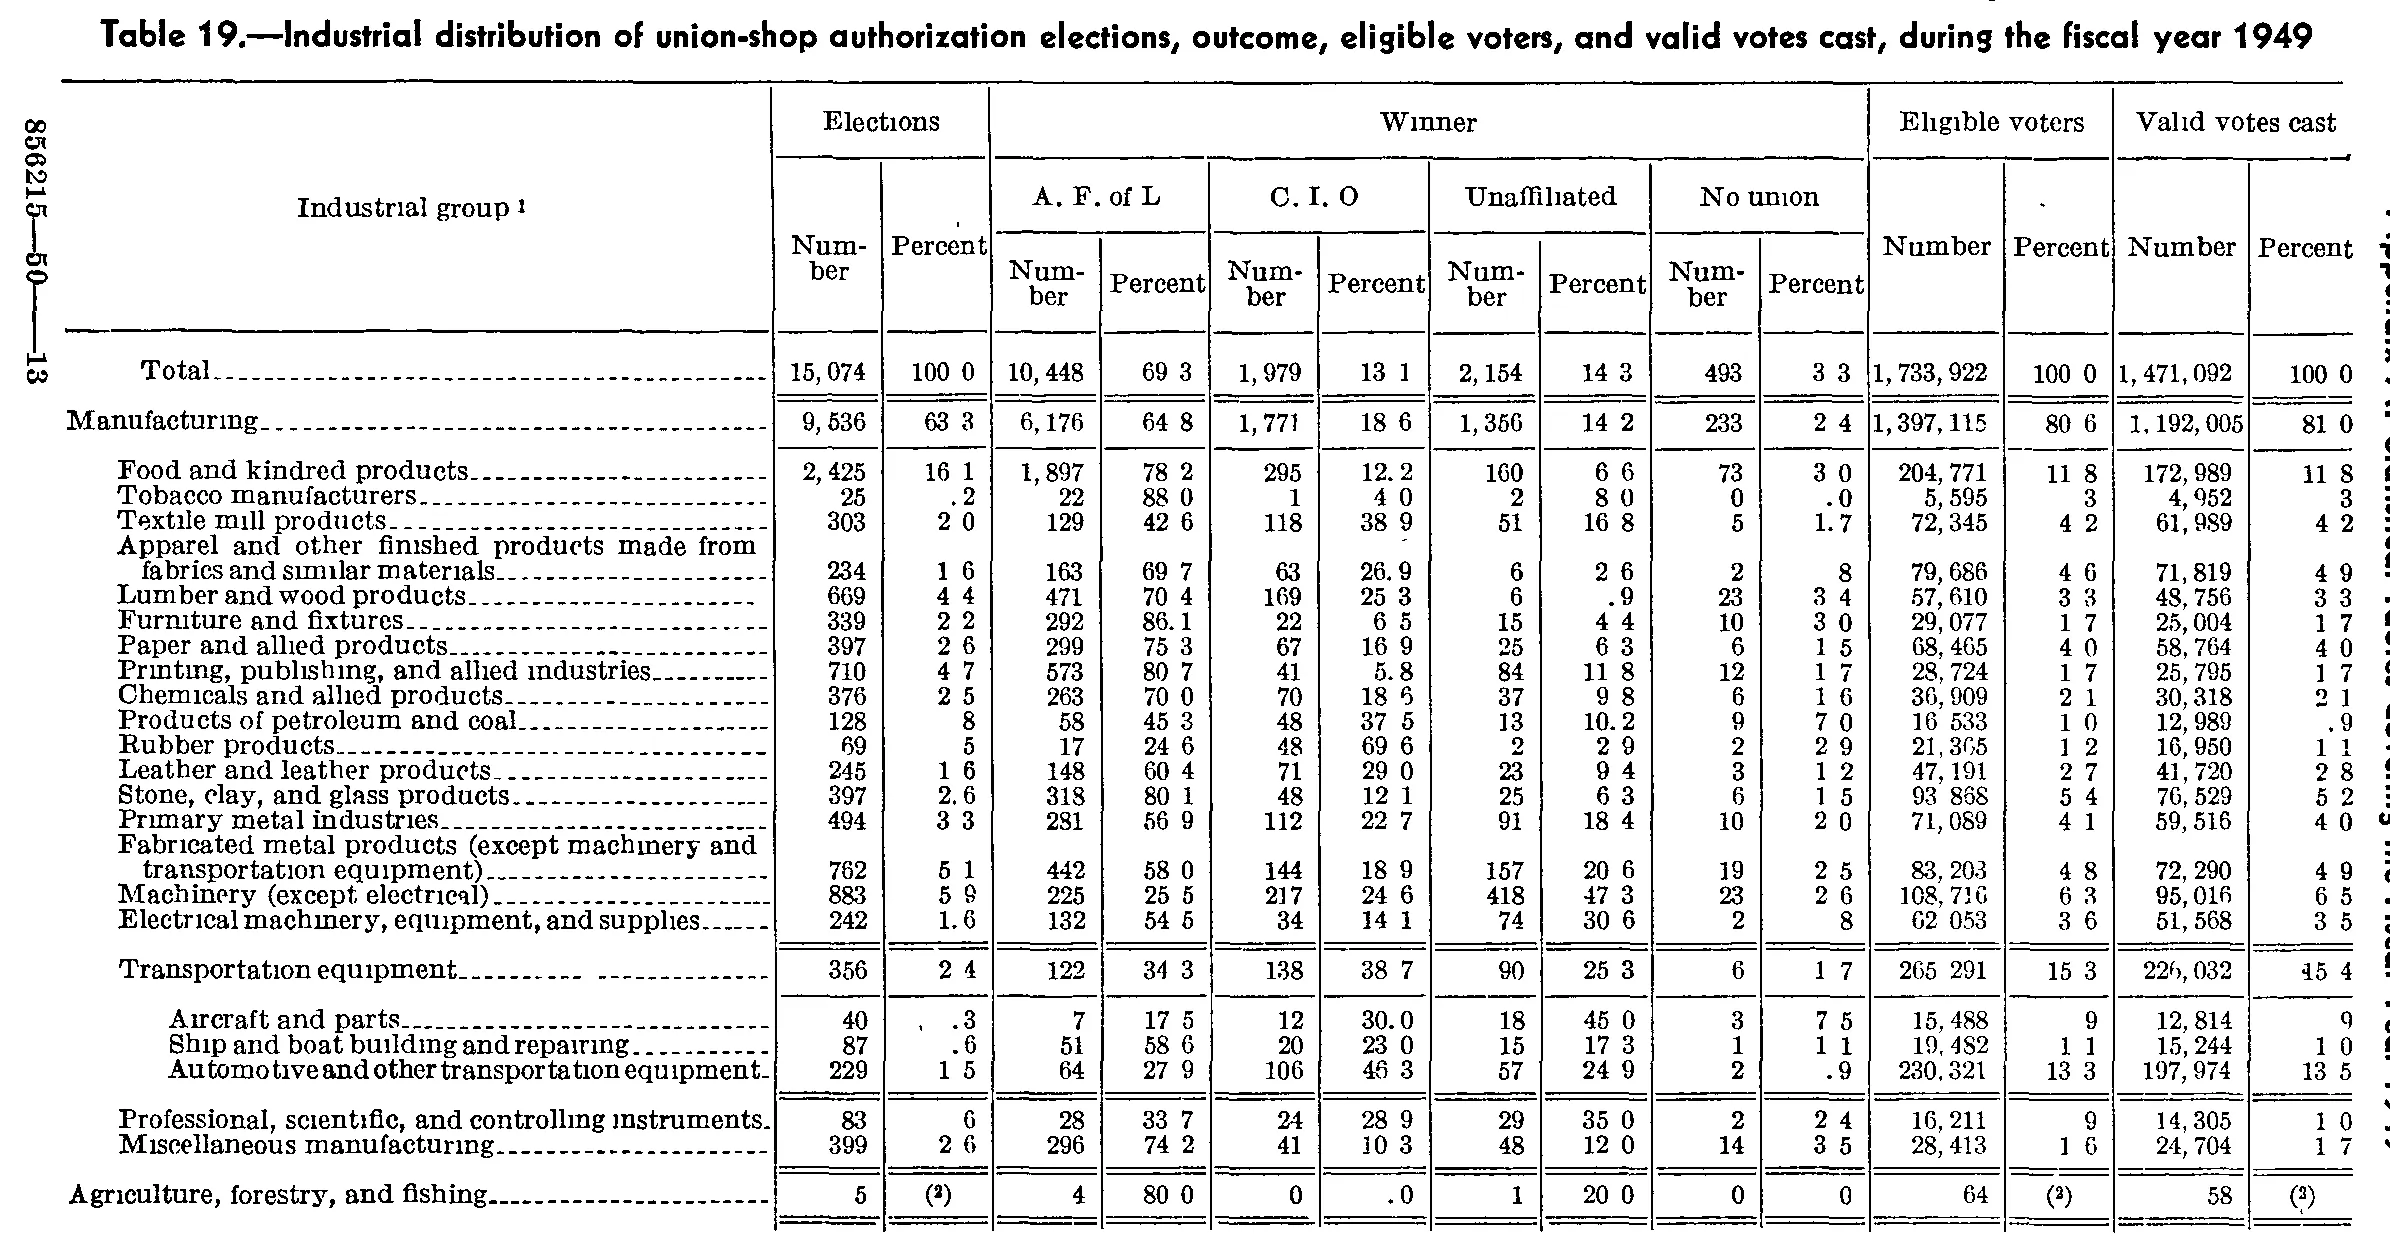
Industrial distribution of union-shop authorization elections, outcome, eligible voters, and valid votes cast, during the fiscal year 1949
Stitched from pp. 194–195.
| Industrial group | Elections | Winner | Eligible voters | Valid votes cast | ||||||||||
|---|---|---|---|---|---|---|---|---|---|---|---|---|---|---|
| Industrial group | Number | Percent | A. F. of L | C. I. O | Unaffiliated | No union | Number | Percent | Number | Percent | ||||
| Industrial group | Number | Percent | Number | Percent | Number | Percent | Number | Percent | Number | Percent | Number | Percent | Number | Percent |
| Total | 15,074 | 100.0 | 10,448 | 69.3 | 1,979 | 13.1 | 2,154 | 14.3 | 493 | 3.3 | 1,733,922 | 100.0 | 1,471,092 | 100.0 |
| Manufacturing | 9,536 | 63.3 | 6,176 | 64.8 | 1,771 | 18.6 | 1,356 | 14.2 | 233 | 2.4 | 1,397,115 | 80.6 | 1,192,005 | 81.0 |
| Food and kindred products | 2,425 | 16.1 | 1,897 | 78.2 | 295 | 12.2 | 160 | 6.6 | 73 | 3.0 | 204,771 | 11.8 | 172,989 | 11.8 |
| Tobacco manufacturers | 25 | .2 | 22 | 88.0 | 1 | 4.0 | 2 | 8.0 | 0 | .0 | 5,595 | .3 | 4,952 | .3 |
| Textile mill products | 303 | 2.0 | 129 | 42.6 | 118 | 38.9 | 51 | 16.8 | 5 | 1.7 | 72,345 | 4.2 | 61,989 | 4.2 |
| Apparel and other finished products made from fabrics and similar materials | 234 | 1.6 | 163 | 69.7 | 63 | 26.9 | 6 | 2.6 | 2 | .8 | 79,686 | 4.6 | 71,819 | 4.9 |
| Lumber and wood products | 669 | 4.4 | 471 | 70.4 | 169 | 25.3 | 6 | .9 | 23 | 3.4 | 57,610 | 3.3 | 48,756 | 3.3 |
| Furniture and fixtures | 339 | 2.2 | 292 | 86.1 | 22 | 6.5 | 15 | 4.4 | 10 | 3.0 | 29,077 | 1.7 | 25,004 | 1.7 |
| Paper and allied products | 397 | 2.6 | 299 | 75.3 | 67 | 16.9 | 25 | 6.3 | 6 | 1.5 | 68,465 | 4.0 | 58,764 | 4.0 |
| Printing, publishing, and allied industries | 710 | 4.7 | 573 | 80.7 | 41 | 5.8 | 84 | 11.8 | 12 | 1.7 | 28,724 | 1.7 | 25,795 | 1.7 |
| Chemicals and allied products | 376 | 2.5 | 263 | 70.0 | 70 | 18.6 | 37 | 9.8 | 6 | 1.6 | 36,909 | 2.1 | 30,318 | 2.1 |
| Products of petroleum and coal | 128 | .8 | 58 | 45.3 | 48 | 37.5 | 13 | 10.2 | 9 | 7.0 | 16,533 | 1.0 | 12,989 | .9 |
| Rubber products | 69 | .5 | 17 | 24.6 | 48 | 69.6 | 2 | 2.9 | 2 | 2.9 | 21,365 | 1.2 | 16,950 | 1.1 |
| Leather and leather products | 245 | 1.6 | 148 | 60.4 | 71 | 29.0 | 23 | 9.4 | 3 | 1.2 | 47,191 | 2.7 | 41,720 | 2.8 |
| Stone, clay, and glass products | 397 | 2.6 | 318 | 80.1 | 48 | 12.1 | 25 | 6.3 | 6 | 1.5 | 93,868 | 5.4 | 76,529 | 5.2 |
| Primary metal industries | 494 | 3.3 | 281 | 56.9 | 112 | 22.7 | 91 | 18.4 | 10 | 2.0 | 71,089 | 4.1 | 59,516 | 4.0 |
| Fabricated metal products (except machinery and transportation equipment) | 762 | 5.1 | 442 | 58.0 | 144 | 18.9 | 157 | 20.6 | 19 | 2.5 | 83,203 | 4.8 | 72,290 | 4.9 |
| Machinery (except electrical) | 883 | 5.9 | 225 | 25.5 | 217 | 24.6 | 418 | 47.3 | 23 | 2.6 | 108,716 | 6.3 | 95,016 | 6.5 |
| Electrical machinery, equipment, and supplies | 242 | 1.6 | 132 | 54.5 | 34 | 14.1 | 74 | 30.6 | 2 | .8 | 62,053 | 3.6 | 51,568 | 3.5 |
| Transportation equipment | 356 | 2.4 | 122 | 34.3 | 138 | 38.7 | 90 | 25.3 | 6 | 1.7 | 265,291 | 15.3 | 226,032 | 15.4 |
| Aircraft and parts | 40 | .3 | 7 | 17.5 | 12 | 30.0 | 18 | 45.0 | 3 | 7.5 | 15,488 | .9 | 12,814 | .9 |
| Ship and boat building and repairing | 87 | .6 | 51 | 58.6 | 20 | 23.0 | 15 | 17.3 | 1 | 1.1 | 19,482 | 1.1 | 15,244 | 1.0 |
| Automotive and other transportation equipment | 229 | 1.5 | 64 | 27.9 | 106 | 46.3 | 57 | 24.9 | 2 | .9 | 230,321 | 13.3 | 197,974 | 13.5 |
| Professional, scientific, and controlling instruments | 83 | .6 | 28 | 33.7 | 24 | 28.9 | 29 | 35.0 | 2 | 2.4 | 16,211 | .9 | 14,305 | 1.0 |
| Miscellaneous manufacturing | 399 | 2.6 | 296 | 74.2 | 41 | 10.3 | 48 | 12.0 | 14 | 3.5 | 28,413 | 1.6 | 24,704 | 1.7 |
| Agriculture, forestry, and fishing | 5 | 4 | 80.0 | 0 | .0 | 1 | 20.0 | 0 | 0 | 64 | 58 | |||
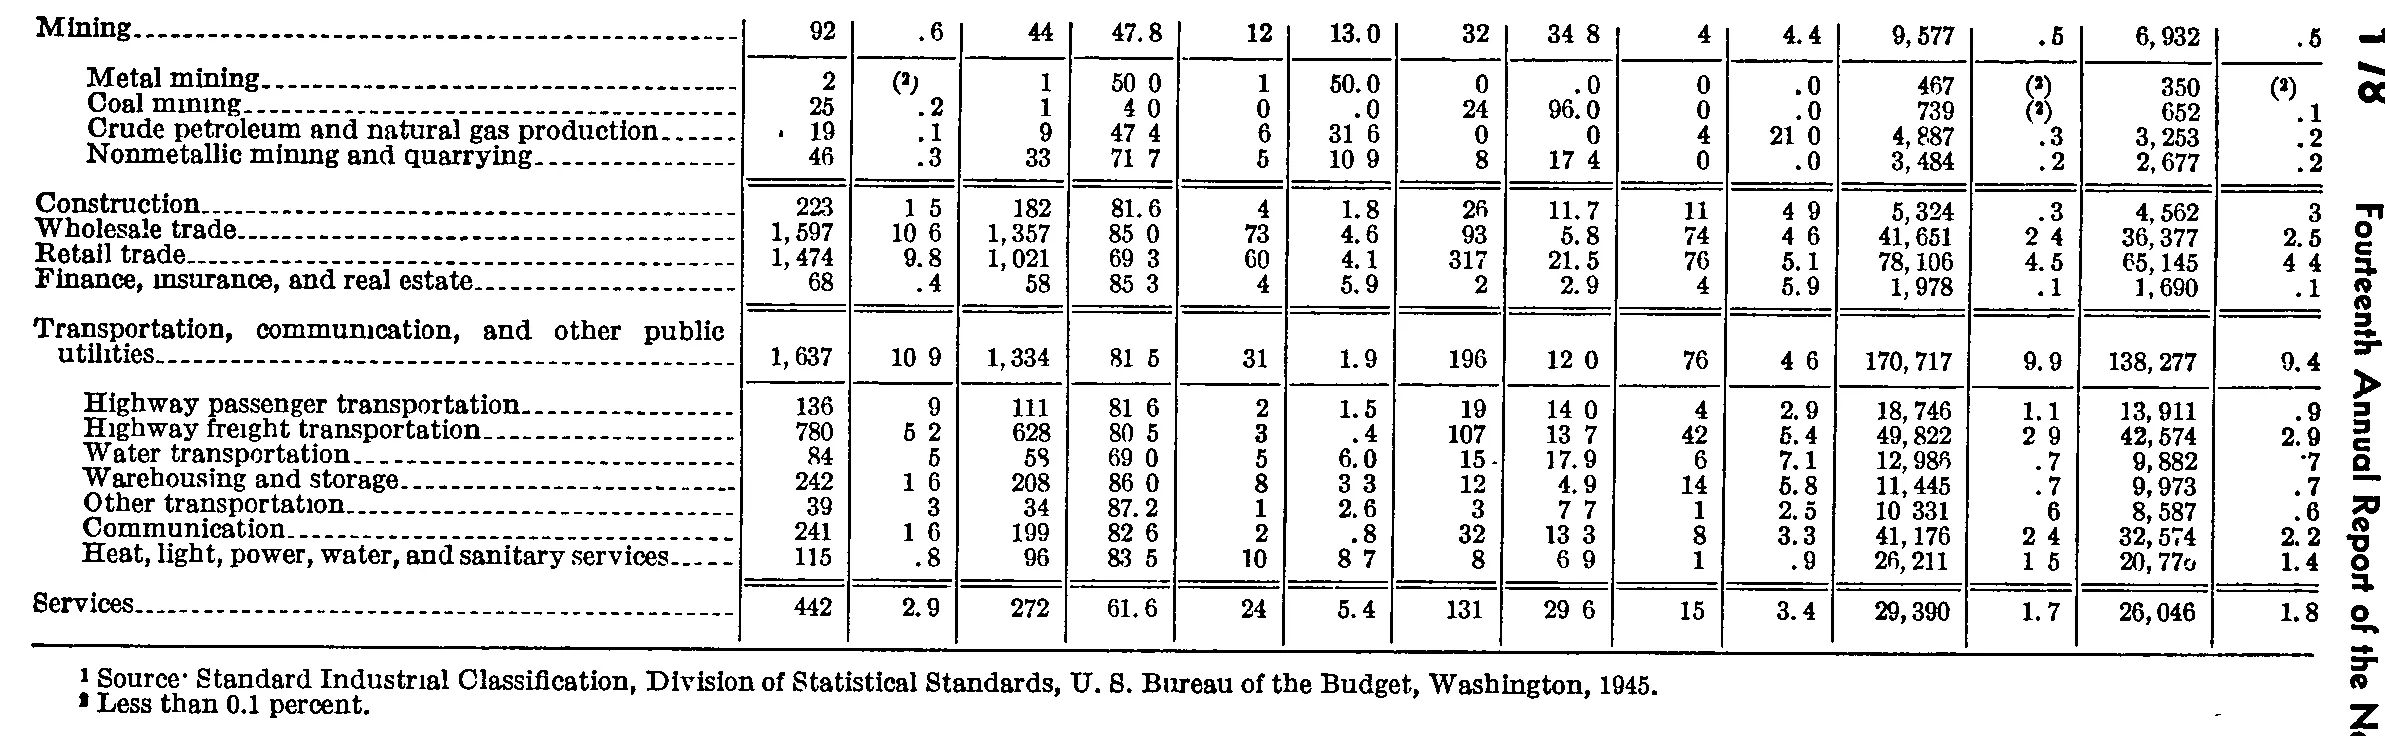
| Mining | 92 | .6 | 44 | 47.8 | 12 | 13.0 | 32 | 34.8 | 4 | 4.4 | 9,577 | .5 | 6,932 | .5 |
| Metal mining | 2 | [2] | 1 | 50.0 | 1 | 50.0 | 0 | .0 | 0 | .0 | 467 | [2] | 350 | [2] |
| Coal mining | 25 | .2 | 1 | 4.0 | 0 | .0 | 24 | 96.0 | 0 | .0 | 739 | [2] | 652 | .1 |
| Crude petroleum and natural gas production | 19 | .1 | 9 | 47.4 | 6 | 31.6 | 0 | .0 | 4 | 21.0 | 4,887 | .3 | 3,253 | .2 |
| Nonmetallic mining and quarrying | 46 | .3 | 33 | 71.7 | 5 | 10.9 | 8 | 17.4 | 0 | .0 | 3,484 | .2 | 2,677 | .2 |
| Construction | 223 | 1.5 | 182 | 81.6 | 4 | 1.8 | 26 | 11.7 | 11 | 4.9 | 5,324 | .3 | 4,562 | .3 |
| Wholesale trade | 1,597 | 10.6 | 1,357 | 85.0 | 73 | 4.6 | 93 | 5.8 | 74 | 4.6 | 41,651 | 2.4 | 36,377 | 2.5 |
| Retail trade | 1,474 | 9.8 | 1,021 | 69.3 | 60 | 4.1 | 317 | 21.5 | 76 | 5.1 | 78,106 | 4.5 | 65,145 | 4.4 |
| Finance, insurance, and real estate | 68 | .4 | 58 | 85.3 | 4 | 5.9 | 2 | 2.9 | 4 | 5.9 | 1,978 | .1 | 1,690 | .1 |
| Transportation, communication, and other public utilities | 1,637 | 10.9 | 1,334 | 81.5 | 31 | 1.9 | 196 | 12.0 | 76 | 4.6 | 170,717 | 9.9 | 138,277 | 9.4 |
| Highway passenger transportation | 136 | .9 | 111 | 81.6 | 2 | 1.5 | 19 | 14.0 | 4 | 2.9 | 18,746 | 1.1 | 13,911 | .9 |
| Highway freight transportation | 780 | 5.2 | 628 | 80.5 | 3 | .4 | 107 | 13.7 | 42 | 5.4 | 49,822 | 2.9 | 42,574 | 2.9 |
| Water transportation | 84 | .5 | 58 | 69.0 | 5 | 6.0 | 15 | 17.9 | 6 | 7.1 | 12,986 | .7 | 9,882 | .7 |
| Warehousing and storage | 242 | 1.6 | 208 | 86.0 | 8 | 3.3 | 12 | 4.9 | 14 | 5.8 | 11,445 | .7 | 9,973 | .7 |
| Other transportation | 39 | .3 | 34 | 87.2 | 1 | 2.6 | 3 | 7.7 | 1 | 2.5 | 10,331 | .6 | 8,587 | .6 |
| Communication | 241 | 1.6 | 199 | 82.6 | 2 | .8 | 32 | 13.3 | 8 | 3.3 | 41,176 | 2.4 | 32,574 | 2.2 |
| Heat, light, power, water, and sanitary services | 115 | .8 | 96 | 83.5 | 10 | 8.7 | 8 | 6.9 | 1 | .9 | 26,211 | 1.5 | 20,776 | 1.4 |
| Services | 442 | 2.9 | 272 | 61.6 | 24 | 5.4 | 131 | 29.6 | 15 | 3.4 | 29,390 | 1.7 | 26,046 | 1.8 |
- 1 Source: Standard Industrial Classification, Division of Statistical Standards, U. S. Bureau of the Budget, Washington, 1945.
- 2 Less than 0.1 percent.
299 of 299 figures sit in a row or column sum that works out.
Reader’s notes
p. 194. Grid is 15 columns: stub, Elections (Number, Percent), Winner split into A. F. of L / C. I. O / Unaffiliated / No union (Number, Percent each), Eligible voters (Number, Percent), Valid votes cast (Number, Percent). Decimal points: this is a coarse 1-bit scan and the period in the percent columns is dropped or nearly dropped in most cells (e.g. the Total row reads "100 0", "69 3", "13 1"). They are decimal percents and have been transcribed with the point restored ("100.0", "69.3"). Every restored decimal is consistent with the ratio recomputed from the printed counts, so the placement is not in doubt; only the glyph is. Leading-decimal values are kept as printed without a leading zero (".2", ".8", ".9"). Thousands commas: likewise dropped or broken in several number cells — "16 533", "93 868", "62 053", "265 291" show no comma, and "230. 321" shows what looks like a period. All are transcribed with a comma (16,533; 93,868; 62,053; 265,291; 230,321); each is confirmed by arithmetic (e.g. 15,488 + 19,482 + 230,321 = 265,291, the Transportation equipment eligible-voters total). Doubtful cell — Transportation equipment, Valid votes cast / Percent: the leading glyph could be read as a 4, giving "45.4". Transcribed 15.4, because 226,032 / 1,471,092 = 15.4 percent and the matching Eligible voters cell is 15.3. Agriculture, forestry, and fishing, No union / Percent: printed as a bare "0", not the ".0" form used in the Tobacco and Agriculture C. I. O cells. Transcribed as printed. Footnote markers 1 (on the stub heading "Industrial group") and 2 (in the three Agriculture cells) are referenced, but no footnote text falls inside this crop, so the footnotes list is empty. The table continues past this page: the rows shown cover only the Manufacturing division and the first line of Agriculture, forestry, and fishing, which sum to 9,541 elections against the printed Total of 15,074. The remaining industrial divisions are on the following page. Minor printed-vs-computed discrepancies, transcribed as printed, not corrected: Apparel No union percent ".8" (2/234 = .85), Transportation equipment C. I. O percent "38.7" (138/356 = 38.8), Ship and boat building Unaffiliated percent "17.3" (15/87 = 17.2). Not transcribed: the printer's signature "856215—50——13" set vertically in the left margin, and the vertical running text in the right margin, which is cut off by the crop.
p. 195. CROP SCOPE: this is a continuation page, so no column headings are printed on the image and header_rows is empty. The grid is 15 columns: stub plus 14 numeric columns, which run as seven number/percent pairs (cols 1-2, 3-4, 5-6, 7-8, 9-10, 11-12, 13-14). Rows above "Mining" are on the preceding page and are not in this crop. The right-hand rule of the last column sits tight against the page edge beside the running head, but all last-column values are legible. ARITHMETIC VERIFICATION: every internal check passes, which is the main support for the digits. The four mining sub-rows sum exactly to the Mining line in cols 1, 3, 5, 7, 9, 11 and 13 (e.g. 467+739+4,887+3,484 = 9,577; 350+652+3,253+2,677 = 6,932). The seven transportation sub-rows sum exactly to the Transportation line in cols 1, 3, 5, 7, 9 and 11 (e.g. 18,746+49,822+12,986+11,445+10,331+41,176+26,211 = 170,717). Within every row, cols 3+5+7+9 equal col 1, and cols 4+6+8+10 total 100.0. FAINT DECIMAL POINTS: the scan drops many thin periods in the percent columns, so the page renders cells such as "34 8", "50 0", "47 4", "31 6", "17 4", "21 0", "7 7", "13 3", "80 5", "81 6", "83 5", "85 3", "69 3", "85 0", "10 6", "4 9", "2 4", "1 5", "8 7", "4 4" with a gap. These are printed decimal points (confirmed by the percentage arithmetic: e.g. 32/92 = 34.8, 1/25 = 4.0, 9/19 = 47.4), and I have written them with the point. The same applies to leading points on values below 1 (".3", ".6", ".0") and to one faint grouping comma, Other transportation col 11, which renders "10 331" and is 10,331 (needed for the column to total 170,717). DOUBTFUL CELLS: - "Heat, light, power, water, and sanitary services", col 13: the final digit is broken and could be read as 0, 6, 8 or 9. I transcribed 20,776 because that is the only reading under which the column sums to the printed Transportation total of 138,277. - "Communication", col 13: read as 32,574; the third digit group is slightly degraded. - "Crude petroleum and natural gas production", col 8: the cell shows a bare "0" with no visible point; written ".0" to match every other zero-percent cell in the table (".0" in cols 8 and 10 of the other mining rows). The value is 0 of 19 either way. - "Crude petroleum and natural gas production", stub/col 1 boundary: a stray leader-dot artifact sits just left of the "19"; it is not a digit. - "Water transportation", col 7: a stray mark follows the "15"; read as 15, which is what the column sum requires. SUSPECTED MISPRINTS, TRANSCRIBED AS PRINTED: - "Coal mining", col 14, printed ".1". The base of col 13 is about 1,470,000 (138,277 = 9.4 percent), so 652 is about 0.04 percent, i.e. under 0.1, where the table elsewhere prints the footnote-2 reference "(2)" — as it does for the same row in col 12 (739). Either the point is a misprint or the cell is a degraded "(2)". - "Other transportation": col 6 is printed 2.6 and col 10 is printed 2.5, although both represent 1 case out of 39. One of the two is wrong. - "Services", col 4: printed 61.6, but 272/442 = 61.5. - "Retail trade", col 10: printed 5.1, but 76/1,474 = 5.2 (the page appears to truncate rather than round in several cells, e.g. 12/242 printed as 4.9 and 8/115 printed as 6.9). "(2)" CELLS: the parenthesised raised 2 stands alone as the cell's entire content, as a reference to footnote 2 ("Less than 0.1 percent") used in place of a value, not as a marker attached to a number. It is transcribed as "(2)". FOOTNOTE 1 PUNCTUATION: the word after "Source" is followed by a mark that renders as a raised dot; I have read it as a colon, the usual setting in this report. Footnote 1's marker refers to the caption or column headings on the preceding page, not to anything in this crop.
Source image
Source data: U.S. NLRB Annual Reports (public domain). Reconstruction by NLRB Stats Archive. Read by claude-opus-5 (effort max, prompt extract_v1) from the 300-dpi scan; stitched by page. Updated October 2026.