NLRB Stats Archive › Annual Reports › FY1949 › Industrial distribution of decertification elections, winner, eligible voters and valid votes cast, during the fiscal year 1949
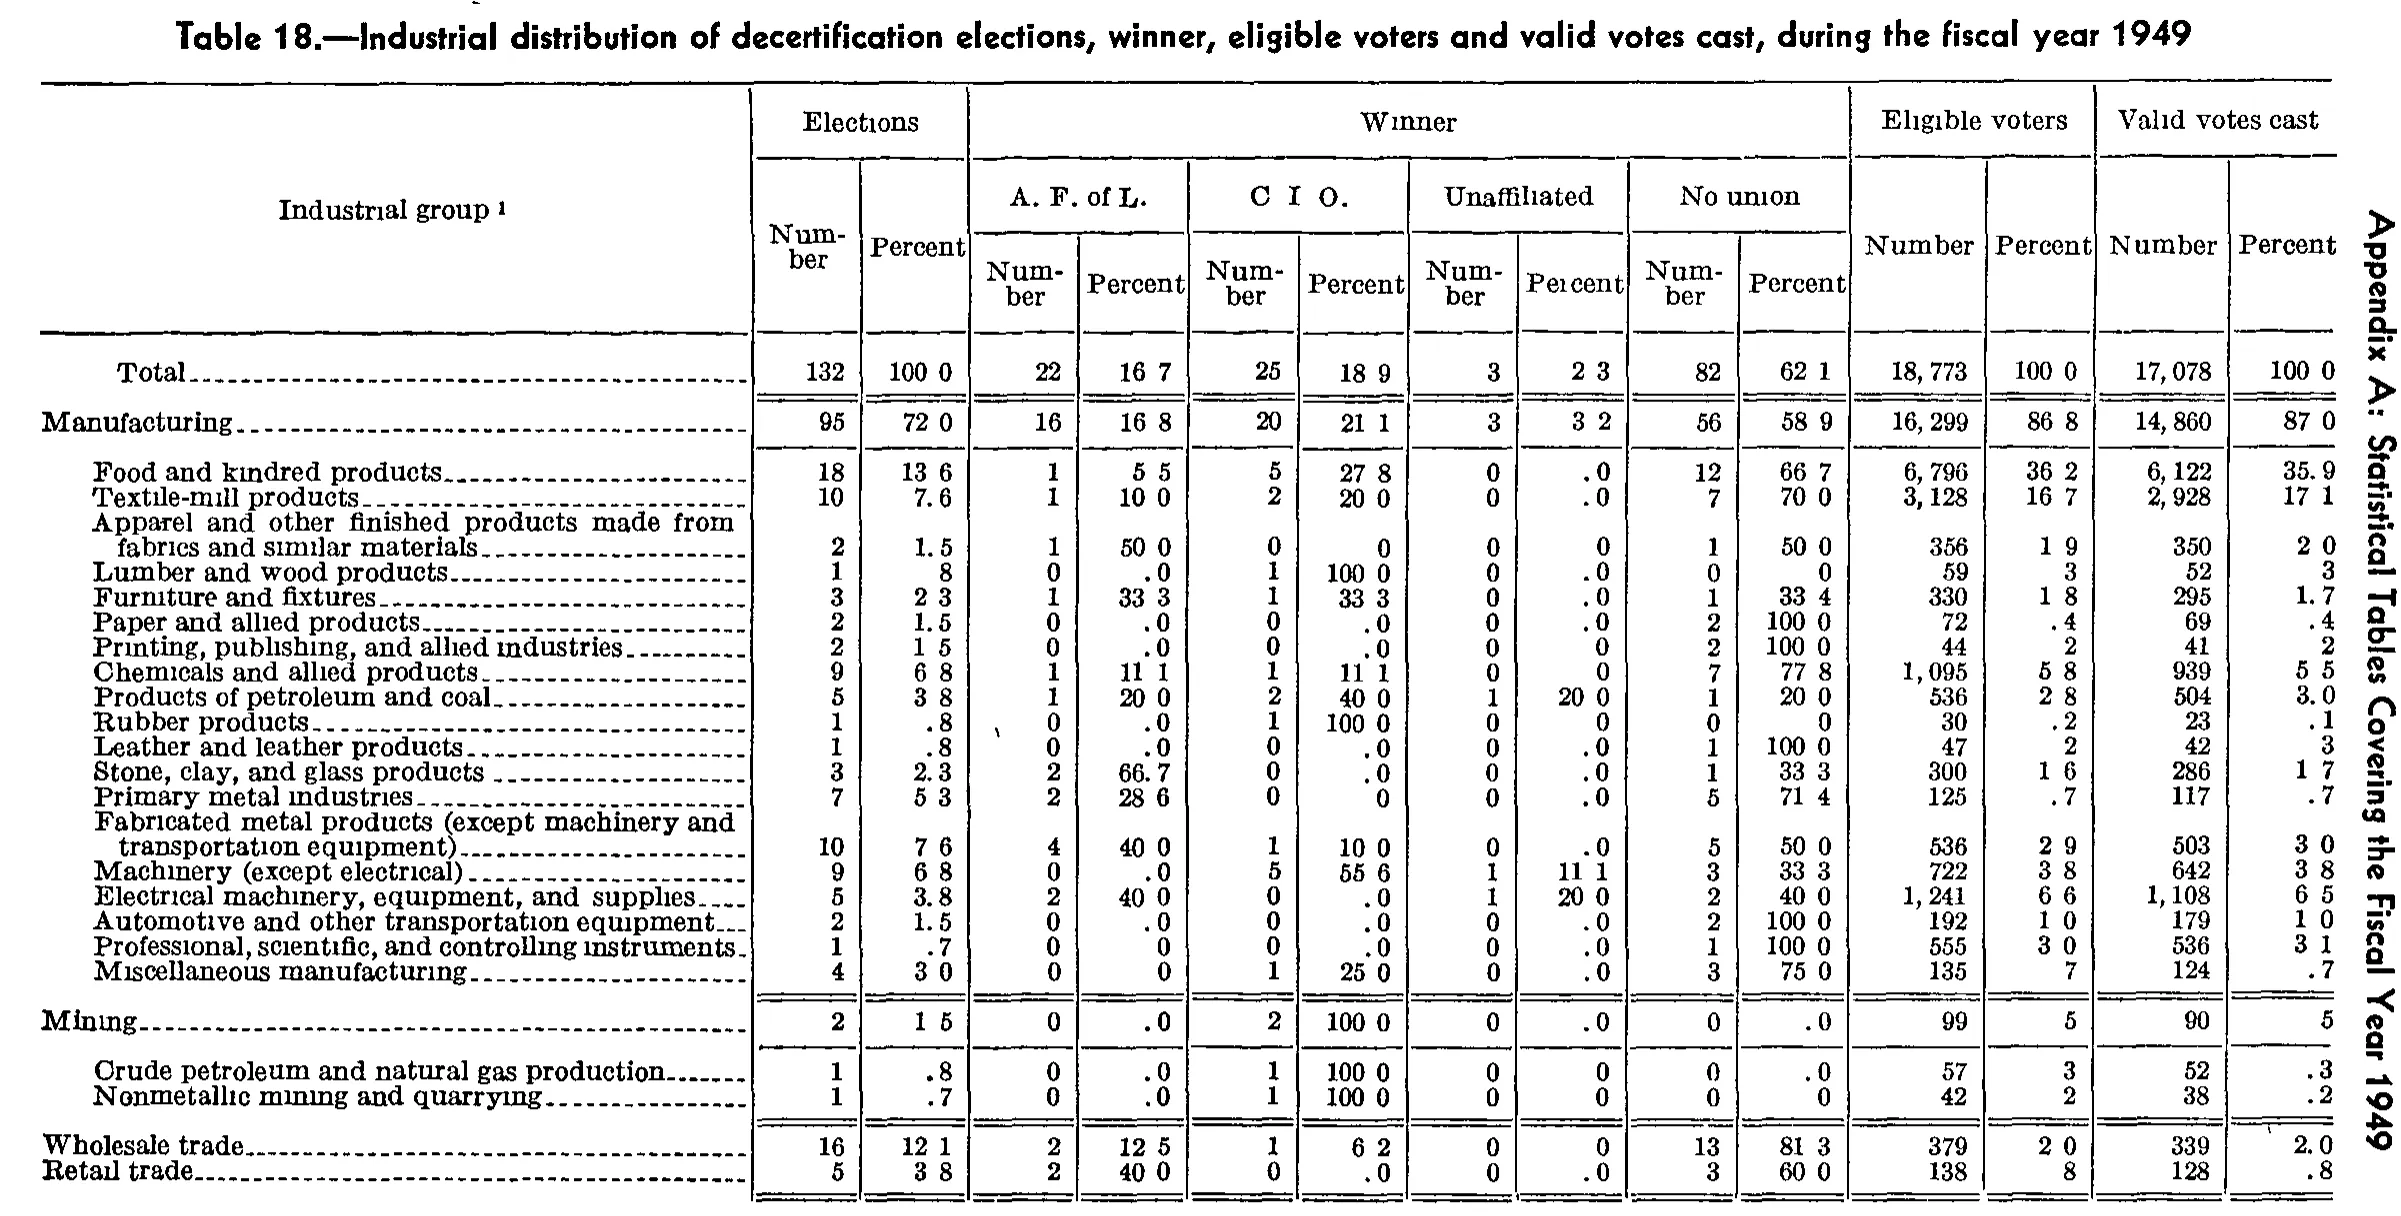
Industrial distribution of decertification elections, winner, eligible voters and valid votes cast, during the fiscal year 1949
Stitched from pp. 192–193.
| Industrial group | Elections | Winner | Eligible voters | Valid votes cast | ||||||||||
|---|---|---|---|---|---|---|---|---|---|---|---|---|---|---|
| Industrial group | Number | Percent | A. F. of L. | C I O. | Unaffiliated | No union | Number | Percent | Number | Percent | ||||
| Industrial group | Number | Percent | Number | Percent | Number | Percent | Number | Percent | Number | Percent | Number | Percent | Number | Percent |
| Total | 132 | 100.0 | 22 | 16.7 | 25 | 18.9 | 3 | 2.3 | 82 | 62.1 | 18,773 | 100.0 | 17,078 | 100.0 |
| Manufacturing | 95 | 72.0 | 16 | 16.8 | 20 | 21.1 | 3 | 3.2 | 56 | 58.9 | 16,299 | 86.8 | 14,860 | 87.0 |
| Food and kindred products | 18 | 13.6 | 1 | 5.5 | 5 | 27.8 | 0 | .0 | 12 | 66.7 | 6,796 | 36.2 | 6,122 | 35.9 |
| Textile-mill products | 10 | 7.6 | 1 | 10.0 | 2 | 20.0 | 0 | .0 | 7 | 70.0 | 3,128 | 16.7 | 2,928 | 17.1 |
| Apparel and other finished products made from fabrics and similar materials | 2 | 1.5 | 1 | 50.0 | 0 | .0 | 0 | .0 | 1 | 50.0 | 356 | 1.9 | 350 | 2.0 |
| Lumber and wood products | 1 | .8 | 0 | .0 | 1 | 100.0 | 0 | .0 | 0 | .0 | 59 | .3 | 52 | .3 |
| Furniture and fixtures | 3 | 2.3 | 1 | 33.3 | 1 | 33.3 | 0 | .0 | 1 | 33.4 | 330 | 1.8 | 295 | 1.7 |
| Paper and allied products | 2 | 1.5 | 0 | .0 | 0 | .0 | 0 | .0 | 2 | 100.0 | 72 | .4 | 69 | .4 |
| Printing, publishing, and allied industries | 2 | 1.5 | 0 | .0 | 0 | .0 | 0 | .0 | 2 | 100.0 | 44 | .2 | 41 | .2 |
| Chemicals and allied products | 9 | 6.8 | 1 | 11.1 | 1 | 11.1 | 0 | .0 | 7 | 77.8 | 1,095 | 5.8 | 939 | 5.5 |
| Products of petroleum and coal | 5 | 3.8 | 1 | 20.0 | 2 | 40.0 | 1 | 20.0 | 1 | 20.0 | 536 | 2.8 | 504 | 3.0 |
| Rubber products | 1 | .8 | 0 | .0 | 1 | 100.0 | 0 | .0 | 0 | .0 | 30 | .2 | 23 | .1 |
| Leather and leather products | 1 | .8 | 0 | .0 | 0 | .0 | 0 | .0 | 1 | 100.0 | 47 | .2 | 42 | .3 |
| Stone, clay, and glass products | 3 | 2.3 | 2 | 66.7 | 0 | .0 | 0 | .0 | 1 | 33.3 | 300 | 1.6 | 286 | 1.7 |
| Primary metal industries | 7 | 5.3 | 2 | 28.6 | 0 | .0 | 0 | .0 | 5 | 71.4 | 125 | .7 | 117 | .7 |
| Fabricated metal products (except machinery and transportation equipment) | 10 | 7.6 | 4 | 40.0 | 1 | 10.0 | 0 | .0 | 5 | 50.0 | 536 | 2.9 | 503 | 3.0 |
| Machinery (except electrical) | 9 | 6.8 | 0 | .0 | 5 | 55.6 | 1 | 11.1 | 3 | 33.3 | 722 | 3.8 | 642 | 3.8 |
| Electrical machinery, equipment, and supplies | 5 | 3.8 | 2 | 40.0 | 0 | .0 | 1 | 20.0 | 2 | 40.0 | 1,241 | 6.6 | 1,108 | 6.5 |
| Automotive and other transportation equipment | 2 | 1.5 | 0 | .0 | 0 | .0 | 0 | .0 | 2 | 100.0 | 192 | 1.0 | 179 | 1.0 |
| Professional, scientific, and controlling instruments | 1 | .7 | 0 | .0 | 0 | .0 | 0 | .0 | 1 | 100.0 | 555 | 3.0 | 536 | 3.1 |
| Miscellaneous manufacturing | 4 | 3.0 | 0 | .0 | 1 | 25.0 | 0 | .0 | 3 | 75.0 | 135 | .7 | 124 | .7 |
| Mining | 2 | 1.5 | 0 | .0 | 2 | 100.0 | 0 | .0 | 0 | .0 | 99 | .5 | 90 | .5 |
| Crude petroleum and natural gas production | 1 | .8 | 0 | .0 | 1 | 100.0 | 0 | .0 | 0 | .0 | 57 | .3 | 52 | .3 |
| Nonmetallic mining and quarrying | 1 | .7 | 0 | .0 | 1 | 100.0 | 0 | .0 | 0 | .0 | 42 | .2 | 38 | .2 |
| Wholesale trade | 16 | 12.1 | 2 | 12.5 | 1 | 6.2 | 0 | .0 | 13 | 81.3 | 379 | 2.0 | 339 | 2.0 |
| Retail trade | 5 | 3.8 | 2 | 40.0 | 0 | .0 | 0 | .0 | 3 | 60.0 | 138 | .8 | 128 | .8 |
| Transportation, communication, and other public utilities | 12 | 9.1 | 2 | 16.7 | 2 | 16.7 | 0 | .0 | 8 | 66.6 | 1,821 | 9.7 | 1,627 | 9.5 |
| Highway freight transportation | 3 | 2.3 | 1 | 33.3 | 0 | .0 | 0 | .0 | 2 | 66.7 | 38 | .2 | 37 | .2 |
| Water transportation | 2 | 1.5 | 0 | .0 | 1 | 50.0 | 0 | .0 | 1 | 50.0 | 36 | .2 | 35 | .2 |
| Warehousing and storage | 2 | 1.5 | 0 | .0 | 1 | 50.0 | 0 | .0 | 1 | 50.0 | 105 | .6 | 100 | .6 |
| Communication | 4 | 3.0 | 0 | .0 | 0 | .0 | 0 | .0 | 4 | 100.0 | 1,547 | 8.2 | 1,364 | 8.0 |
| Heat, light, power, water, and sanitary services | 1 | .8 | 1 | 100.0 | 0 | .0 | 0 | .0 | 0 | .0 | 95 | .5 | 91 | .5 |
| Services | 2 | 1.5 | 0 | .0 | 0 | .0 | 0 | .0 | 2 | 100.0 | 37 | .2 | 34 | .2 |
- 1 Source: Standard Industrial Classification, Division of Statistical Standards, U. S. Bureau of the Budget, Washington, 1945.
153 of 167 figures sit in a row or column sum that works out.
Reader’s notes
p. 192. CROP IS INCOMPLETE. The body ends at "Retail trade"; the table continues on the following page. The four major groups shown (Manufacturing 95, Mining 2, Wholesale trade 16, Retail trade 5) sum to 118 of the printed Total of 132 elections, and their eligible voters (16,299 + 99 + 379 + 138 = 16,915) fall 1,858 short of the printed 18,773, so roughly 14 elections in further industry groups are cut off below. DECIMAL POINTS. This is a 1-bit scan in which the period in the percent columns very often fails to reproduce: the same column prints "7.6" and "1.5" clearly but renders 100.0 as "100 0", 16.7 as "16 7", and .3 as a bare "3". I have restored the decimal point throughout the four percent column pairs, because the point is unmistakably part of the printed one-decimal format (it survives in enough cells to establish it) and because every column sum reconciles on that reading. The "Eligible voters / Percent" column is the worst affected — in it the leading period is lost in nearly every sub-1 value (Lumber .3, Printing .2, Rubber .2, Leather .2, Primary metal .7, Miscellaneous manufacturing .7, Mining .5, Crude petroleum .3, Nonmetallic .2, Retail trade .8). No digit was added or removed anywhere; only the point was restored. VERIFICATION. The 19 manufacturing detail rows sum exactly to the printed "Manufacturing" line in all six count columns (elections 95, A.F. of L. 16, C I O. 20, Unaffiliated 3, No union 56, eligible voters 16,299, valid votes 14,860), and the two mining detail rows sum exactly to the "Mining" line (57 + 42 = 99; 52 + 38 = 90). This gives high confidence in the digits and in the column assignment. DOUBTFUL / APPARENTLY MISPRINTED CELLS (transcribed as printed, not corrected): - "Food and kindred products", A. F. of L. Percent: read as 5.5, but 1 of 18 elections is 5.6. Either a misprint or a 5/6 confusion in the scan; 5.5 is my reading of the glyph. - "Products of petroleum and coal" and "Fabricated metal products ...", Eligible voters Percent: both rows have 536 eligible voters but print 2.8 and 2.9 respectively. Inconsistent rounding as printed; left as printed. - "Leather and leather products", Valid votes cast Percent: read as .3, though 42 of 17,078 is .25. Glyph is small and the reading is not certain between .2 and .3. - "Retail trade", Eligible voters Percent: read as .8, though 138 of 18,773 is .74. Not certain between .7 and .8. HEADINGS. Three heading levels. "Elections", "Eligible voters" and "Valid votes cast" each span a Number/Percent pair whose sub-headings are set tall across levels 2 and 3, so those sub-headings are repeated in both levels. "Winner" spans eight columns (four union categories x Number/Percent). The stub heading "Industrial group" carries footnote marker 1, but no footnote text for it appears on this crop.
p. 193. The crop carries no column headings — it continues a table from the preceding page — so header_rows is empty. I counted 15 columns from the vertical rules: the stub plus 14 numeric columns that run as seven (number, percent) pairs. Decimal points: this is a coarse 1-bit scan and most of the periods in the percent columns are not resolvable in the image; many percent cells appear as a digit pair separated by a gap ("9 1", "16 7", "66 6") or as a bare digit sitting in the decimal position. I have written them as decimals. The restoration is supported by (a) right-alignment — the lone digits sit under the tenths position, with the units position blank — and (b) arithmetic: the five indented rows sum to the "Transportation, communication, and other public utilities" line in all 14 columns (12; 9.1; 2; 2; 0; 8; 1,821; 9.7; 1,627; 9.5), and each row's four disposition percents sum to 100.0. Cells where no period at all is visible in the image and the leading "." is my reconstruction: column 2 of "Heat, light, power, water, and sanitary services" (printed as a bare 8, read .8 — confirmed because 2.3+1.5+1.5+3.0+.8 = 9.1, the printed group figure); column 12 of the "Highway freight transportation", "Water transportation", "Warehousing and storage", "Heat, light, power, water, and sanitary services" and "Services" rows (bare 2, 2, 6, 5, 2 read as .2, .2, .6, .5, .2 — they sum to the printed 9.7); column 14 of "Services" (bare 2, read .2). Several zero-percent cells also print as a bare 0 where other rows of the same column plainly show ".0" (e.g. column 8 in nearly every row, column 4 in "Water transportation" and "Communication", column 6 in "Services"); I have written ".0" uniformly. A transcriber wanting strict as-seen text should drop these leading periods. Footnote 1: the punctuation after "Source" is not legible in the scan; I rendered it as a colon, matching the report's usual style. The right-hand edge of the crop carries rotated running-head text from the page furniture, which I have not transcribed. No row or value appears to be cut off by the crop; the body begins mid-table and ends at the "Services" line.
Source image

Source data: U.S. NLRB Annual Reports (public domain). Reconstruction by NLRB Stats Archive. Read by claude-opus-5 (effort max, prompt extract_v1) from the 300-dpi scan; stitched by page. Updated October 2026.