NLRB Stats Archive › Annual Reports › FY1949 › Types of elections conducted during the fiscal year 1949
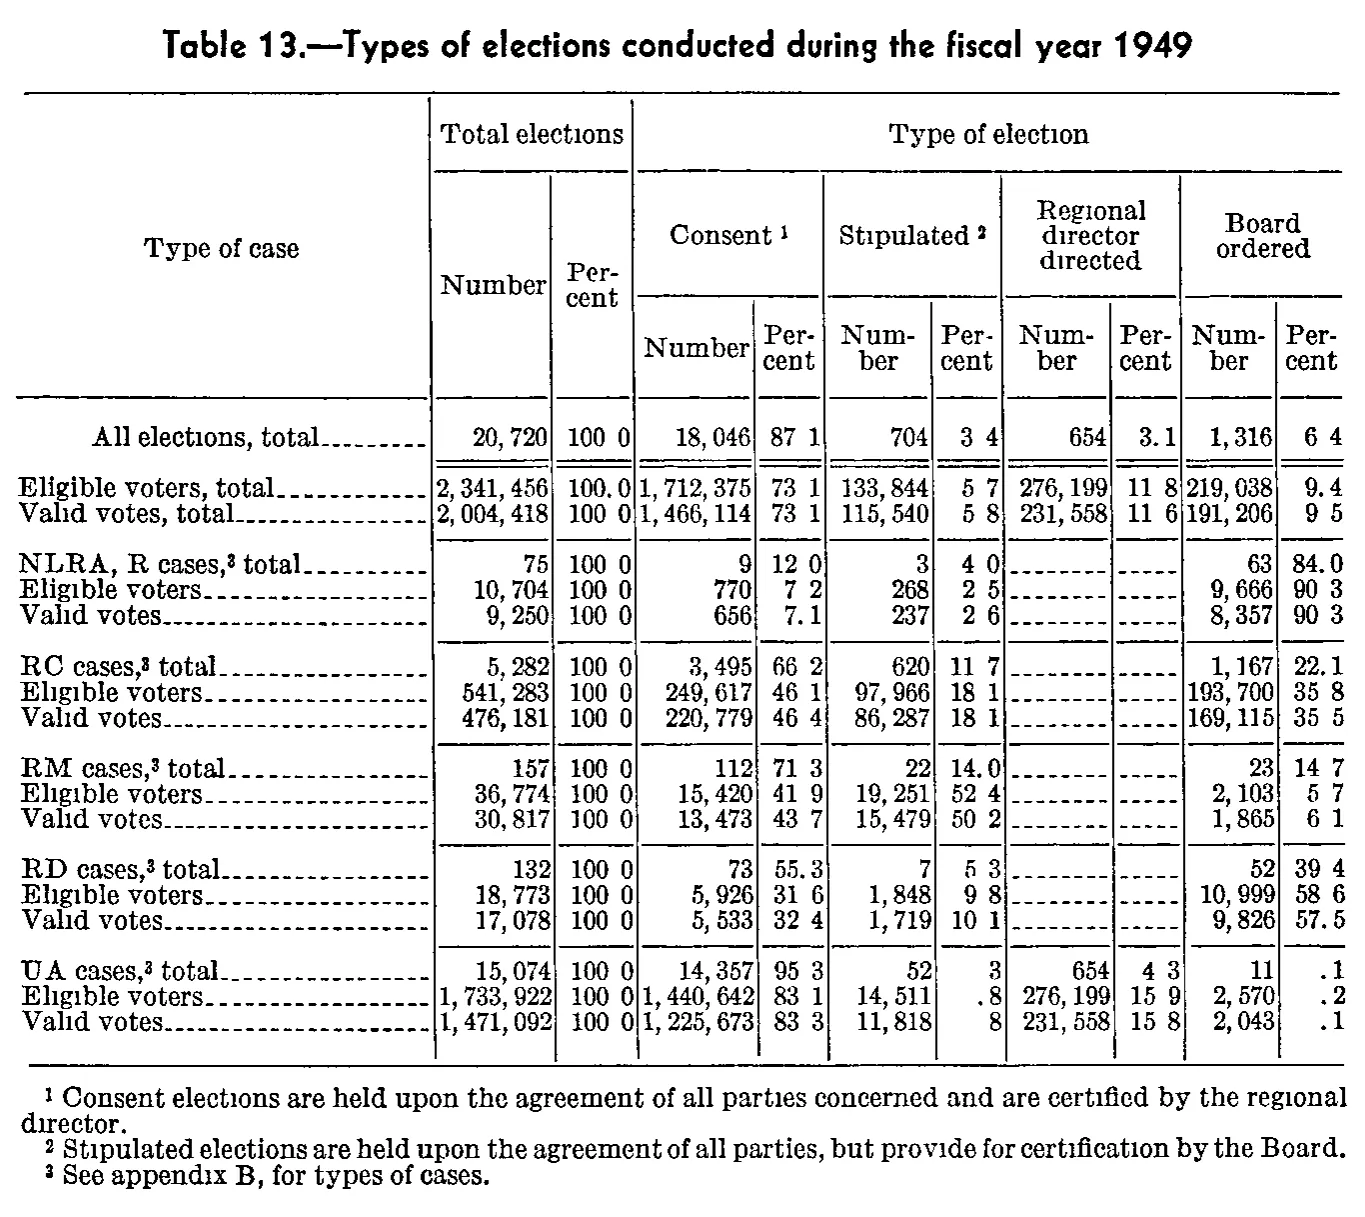
Types of elections conducted during the fiscal year 1949
| Type of case | Total elections | Type of election | ||||||||
|---|---|---|---|---|---|---|---|---|---|---|
| Type of case | Number | Percent | Consent | Stipulated | Regional director directed | Board ordered | ||||
| Type of case | Number | Percent | Number | Percent | Number | Percent | Number | Percent | Number | Percent |
| All elections, total | 20,720 | 100.0 | 18,046 | 87.1 | 704 | 3.4 | 654 | 3.1 | 1,316 | 6.4 |
| Eligible voters, total | 2,341,456 | 100.0 | 1,712,375 | 73.1 | 133,844 | 5.7 | 276,199 | 11.8 | 219,038 | 9.4 |
| Valid votes, total | 2,004,418 | 100.0 | 1,466,114 | 73.1 | 115,540 | 5.8 | 231,558 | 11.6 | 191,206 | 9.5 |
| NLRA, R cases, total | 75 | 100.0 | 9 | 12.0 | 3 | 4.0 | 63 | 84.0 | ||
| Eligible voters | 10,704 | 100.0 | 770 | 7.2 | 268 | 2.5 | 9,666 | 90.3 | ||
| Valid votes | 9,250 | 100.0 | 656 | 7.1 | 237 | 2.6 | 8,357 | 90.3 | ||
| RC cases, total | 5,282 | 100.0 | 3,495 | 66.2 | 620 | 11.7 | 1,167 | 22.1 | ||
| Eligible voters | 541,283 | 100.0 | 249,617 | 46.1 | 97,966 | 18.1 | 193,700 | 35.8 | ||
| Valid votes | 476,181 | 100.0 | 220,779 | 46.4 | 86,287 | 18.1 | 169,115 | 35.5 | ||
| RM cases, total | 157 | 100.0 | 112 | 71.3 | 22 | 14.0 | 23 | 14.7 | ||
| Eligible voters | 36,774 | 100.0 | 15,420 | 41.9 | 19,251 | 52.4 | 2,103 | 5.7 | ||
| Valid votes | 30,817 | 100.0 | 13,473 | 43.7 | 15,479 | 50.2 | 1,865 | 6.1 | ||
| RD cases, total | 132 | 100.0 | 73 | 55.3 | 7 | 5.3 | 52 | 39.4 | ||
| Eligible voters | 18,773 | 100.0 | 5,926 | 31.6 | 1,848 | 9.8 | 10,999 | 58.6 | ||
| Valid votes | 17,078 | 100.0 | 5,533 | 32.4 | 1,719 | 10.1 | 9,826 | 57.5 | ||
| UA cases, total | 15,074 | 100.0 | 14,357 | 95.3 | 52 | .3 | 654 | 4.3 | 11 | .1 |
| Eligible voters | 1,733,922 | 100.0 | 1,440,642 | 83.1 | 14,511 | .8 | 276,199 | 15.9 | 2,570 | .2 |
| Valid votes | 1,471,092 | 100.0 | 1,225,673 | 83.3 | 11,818 | .8 | 231,558 | 15.8 | 2,043 | .1 |
- 1 Consent elections are held upon the agreement of all parties concerned and are certified by the regional director.
- 2 Stipulated elections are held upon the agreement of all parties, but provide for certification by the Board.
- 3 See appendix B, for types of cases.
78 of 78 figures sit in a row or column sum that works out.
Reader’s notes
p. 186. Eleven columns: stub, Total elections (Number, Percent), then Number/Percent pairs under Consent, Stipulated, Regional director directed, and Board ordered. "Number" and "Percent" under "Total elections" are tall headings spanning the second and third heading levels, so they are repeated in both. Decimal points: in this scan the decimal point drops out of most percent cells, which print as e.g. "100 0", "87 1", "73 1", "12 0". The columns are uniformly one-decimal percentages and the values reconcile against the counts (18,046/20,720 = 87.1, 704/20,720 = 3.4, 654/20,720 = 3.1, 1,316/20,720 = 6.4), so I have restored the decimal point in every such cell. Cells where the point is plainly inked (9.4, 7.1, 3.1, 22.1, 55.3, 57.5, 84.0, 35.5, .1, .2, .8) are transcribed as printed. Two cells print as a bare digit with no visible point: Stipulated-Percent for "UA cases,^3 total" (shown as "3") and for "Valid votes" under UA cases (shown as "8"). Given the neighbouring ".8"/".2"/".1" values in that column and the ratios (52/15,074 = 0.3 percent; 11,818/1,471,092 = 0.8 percent), I transcribed these as ".3" and ".8". Regional-director-directed Number and Percent are a dash rule ("-------" / "-----") for all NLRA R, RC, RM and RD rows; these are recorded as empty cells. Possible rounding discrepancies, transcribed as printed and not corrected: Board-ordered Percent for "RM cases,^3 total" reads 14.7 where 23/157 = 14.65; Stipulated Percent for RM "Eligible voters" reads 52.4 where 19,251/36,774 = 52.35; Board-ordered Percent for UA "Eligible voters" reads .2 where 2,570/1,733,922 = 0.15; Regional-director Percent for UA "Valid votes" reads 15.8 where 231,558/1,471,092 = 15.74. The footnote marker on the case-type labels is printed after the comma ("NLRA, R cases,3 total"), and is written in that position.
Source image
Source data: U.S. NLRB Annual Reports (public domain). Reconstruction by NLRB Stats Archive. Read by claude-opus-5 (effort max, prompt extract_v1) from the 300-dpi scan; stitched by page. Updated October 2026.