NLRB Stats Archive › Annual Reports › FY1949 › Regional distribution of cases received
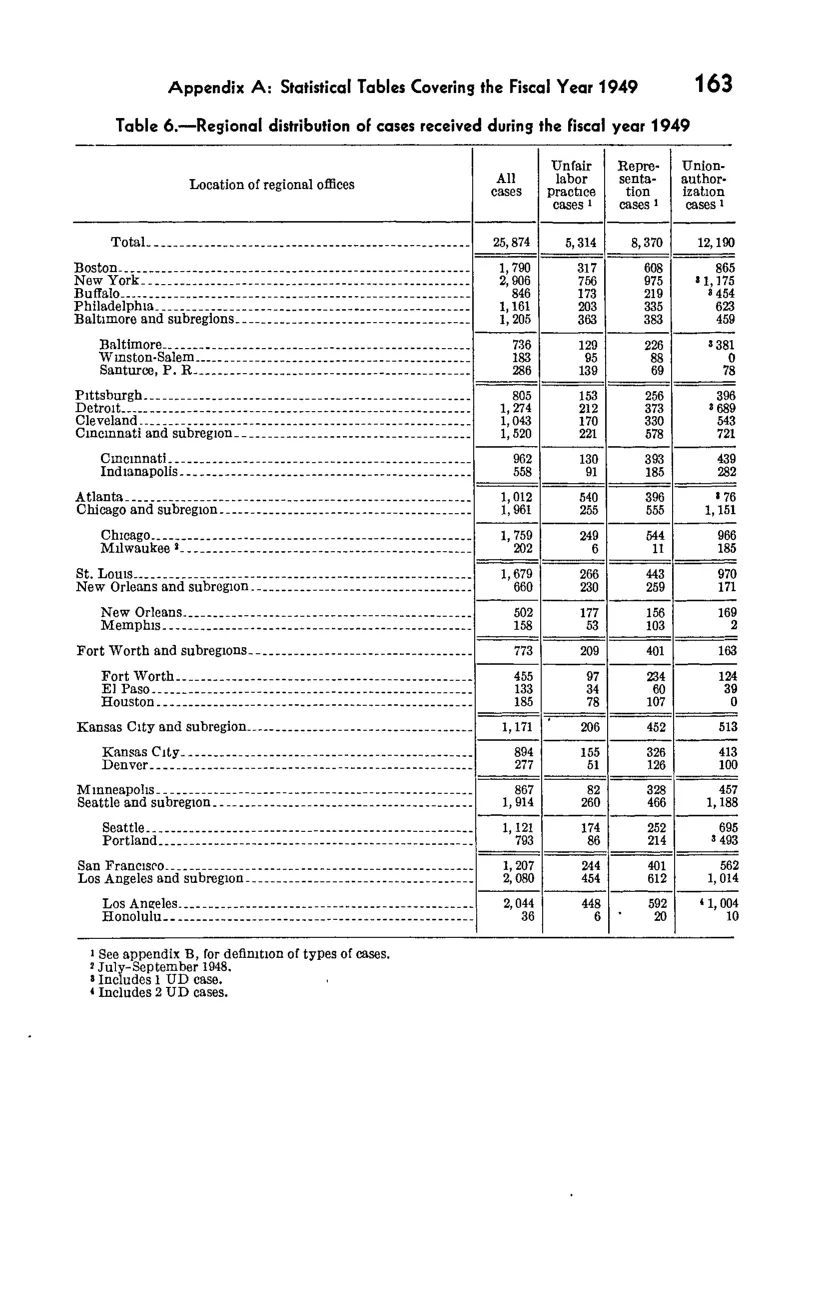
Regional distribution of cases received
| Location of regional offices | All cases | Unfair labor practice cases | Representation cases | Union-shop authorization cases |
|---|---|---|---|---|
| Total | 25,874 | 5,314 | 8,370 | 12,190 |
| Boston | 1,790 | 317 | 608 | 865 |
| New York | 2,906 | 756 | 975 | 1,175 |
| Buffalo | 846 | 173 | 219 | 454 |
| Philadelphia | 1,161 | 203 | 335 | 623 |
| Baltimore and subregions | 1,205 | 383 | 383 | 459 |
| Baltimore and subregions — Baltimore | 736 | 129 | 226 | 381 |
| Baltimore and subregions — Winston-Salem | 183 | 95 | 88 | 0 |
| Baltimore and subregions — Santurce, P. R. | 286 | 139 | 69 | 78 |
| Pittsburgh | 805 | 153 | 256 | 396 |
| Detroit | 1,274 | 212 | 373 | 689 |
| Cleveland | 1,043 | 170 | 330 | 543 |
| Cincinnati and subregion | 1,520 | 221 | 578 | 721 |
| Cincinnati and subregion — Cincinnati | 962 | 130 | 393 | 439 |
| Cincinnati and subregion — Indianapolis | 558 | 91 | 185 | 282 |
| Atlanta | 1,012 | 540 | 396 | 76 |
| Chicago and subregion | 1,961 | 255 | 555 | 1,151 |
| Chicago and subregion — Chicago | 1,759 | 249 | 544 | 966 |
| Chicago and subregion — Milwaukee | 202 | 6 | 11 | 185 |
| St. Louis | 1,679 | 266 | 443 | 970 |
| New Orleans and subregion | 660 | 230 | 259 | 171 |
| New Orleans and subregion — New Orleans | 502 | 177 | 156 | 169 |
| New Orleans and subregion — Memphis | 158 | 53 | 103 | 2 |
| Fort Worth and subregions | 773 | 209 | 401 | 163 |
| Fort Worth and subregions — Fort Worth | 455 | 97 | 234 | 124 |
| Fort Worth and subregions — El Paso | 133 | 34 | 60 | 39 |
| Fort Worth and subregions — Houston | 185 | 78 | 107 | 0 |
| Kansas City and subregion | 1,171 | 206 | 452 | 513 |
| Kansas City and subregion — Kansas City | 894 | 155 | 326 | 413 |
| Kansas City and subregion — Denver | 277 | 51 | 126 | 100 |
| Minneapolis | 867 | 82 | 328 | 457 |
| Seattle and subregion | 1,914 | 260 | 466 | 1,188 |
| Seattle and subregion — Seattle | 1,121 | 174 | 252 | 695 |
| Seattle and subregion — Portland | 793 | 86 | 214 | 493 |
| San Francisco | 1,207 | 244 | 401 | 562 |
| Los Angeles and subregion | 2,080 | 454 | 612 | 1,014 |
| Los Angeles and subregion — Los Angeles | 2,044 | 448 | 592 | 1,004 |
| Los Angeles and subregion — Honolulu | 36 | 6 | 20 | 10 |
Source image
Source data: U.S. NLRB Annual Reports (public domain). Reconstruction by NLRB Stats Archive. Updated June 2026.