NLRB Stats Archive › Annual Reports › FY1949 › Monthly distribution of cases received during the fiscal year 1949
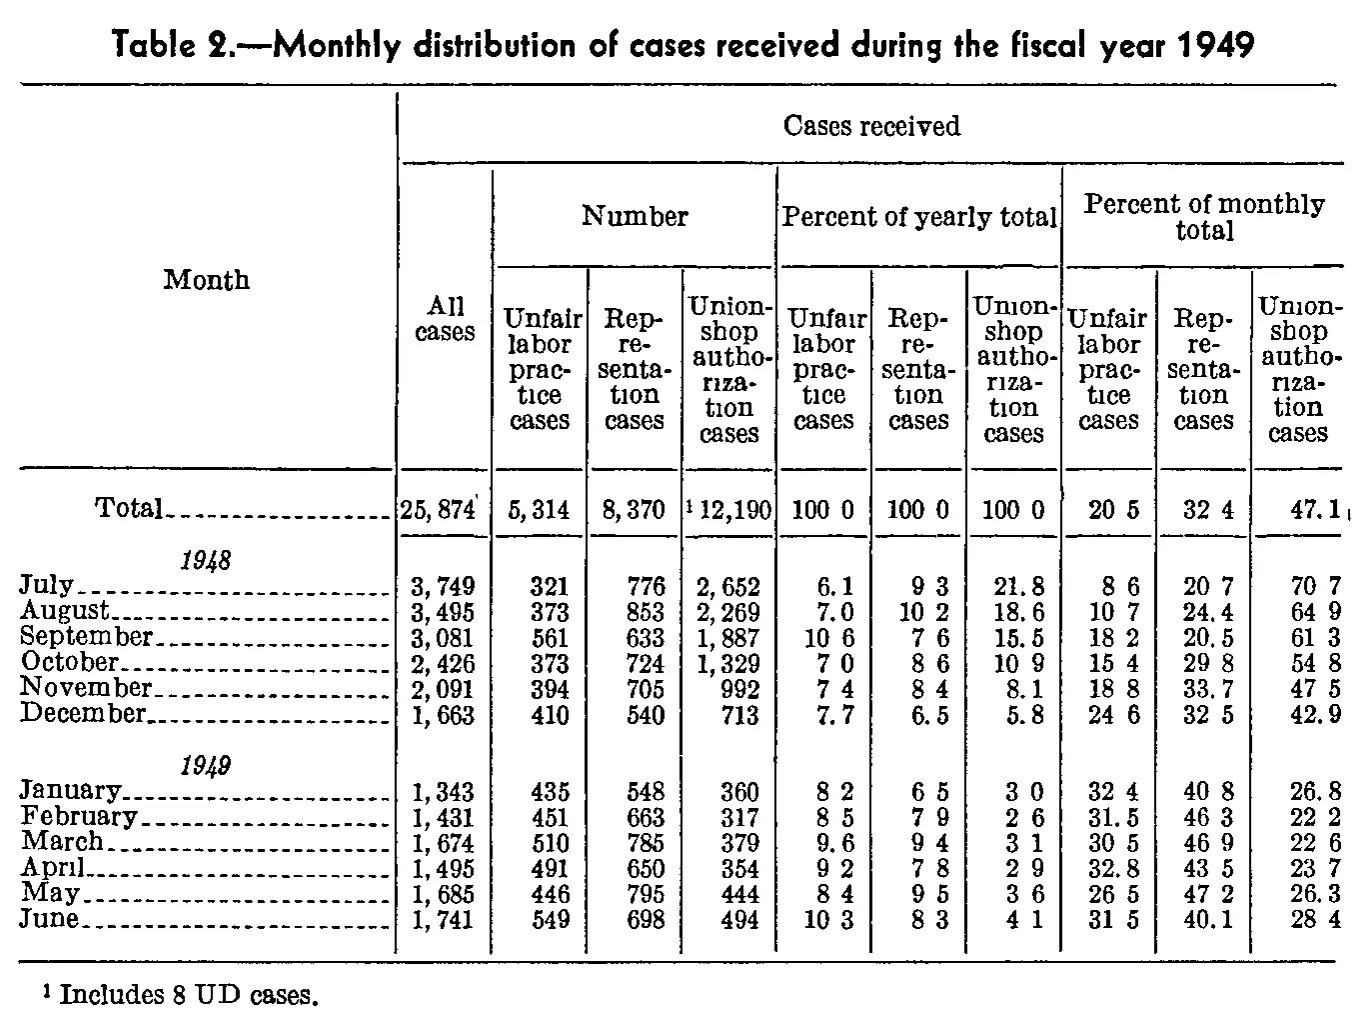
Monthly distribution of cases received during the fiscal year 1949
| Month | Cases received | |||||||||
|---|---|---|---|---|---|---|---|---|---|---|
| Month | All cases | Number | Percent of yearly total | Percent of monthly total | ||||||
| Month | All cases | Unfair labor practice cases | Representation cases | Union-shop authorization cases | Unfair labor practice cases | Representation cases | Union-shop authorization cases | Unfair labor practice cases | Representation cases | Union-shop authorization cases |
| Total | 25,874 | 5,314 | 8,370 | 12,190 | 100.0 | 100.0 | 100.0 | 20.5 | 32.4 | 47.1 |
| 1948 | ||||||||||
| July | 3,749 | 321 | 776 | 2,652 | 6.1 | 9.3 | 21.8 | 8.6 | 20.7 | 70.7 |
| August | 3,495 | 373 | 853 | 2,269 | 7.0 | 10.2 | 18.6 | 10.7 | 24.4 | 64.9 |
| September | 3,081 | 561 | 633 | 1,887 | 10.6 | 7.6 | 15.5 | 18.2 | 20.5 | 61.3 |
| October | 2,426 | 373 | 724 | 1,329 | 7.0 | 8.6 | 10.9 | 15.4 | 29.8 | 54.8 |
| November | 2,091 | 394 | 705 | 992 | 7.4 | 8.4 | 8.1 | 18.8 | 33.7 | 47.5 |
| December | 1,663 | 410 | 540 | 713 | 7.7 | 6.5 | 5.8 | 24.6 | 32.5 | 42.9 |
| 1949 | ||||||||||
| January | 1,343 | 435 | 548 | 360 | 8.2 | 6.5 | 3.0 | 32.4 | 40.8 | 26.8 |
| February | 1,431 | 451 | 663 | 317 | 8.5 | 7.9 | 2.6 | 31.5 | 46.3 | 22.2 |
| March | 1,674 | 510 | 785 | 379 | 9.6 | 9.4 | 3.1 | 30.5 | 46.9 | 22.6 |
| April | 1,495 | 491 | 650 | 354 | 9.2 | 7.8 | 2.9 | 32.8 | 43.5 | 23.7 |
| May | 1,685 | 446 | 795 | 444 | 8.4 | 9.5 | 3.6 | 26.5 | 47.2 | 26.3 |
| June | 1,741 | 549 | 698 | 494 | 10.3 | 8.3 | 4.1 | 31.5 | 40.1 | 28.4 |
- 1 Includes 8 UD cases.
52 of 52 figures sit in a row or column sum that works out.
Reader’s notes
p. 176. Decimal points: in the three percent panels many decimal points are faint or dropped entirely in this scan, so cells print as e.g. \"100 0\", \"9 3\", \"8 6\". I have transcribed them with the decimal point, since neighbouring cells in the same columns show the point clearly (e.g. 47.1, 31.5, 46.3, 10.2) and every value reconciles with the printed counts: each Number row sums to its All cases figure, and each percent equals the corresponding ratio to one decimal place. No digits were altered.\n\nThe \"1948\" and \"1949\" lines are italic section headings with no values.\n\nThe Total row's union-shop entry is printed with a raised 1 before the figure (\"1 12,190\"); recorded as 12,190^1.\n\nRounding in the source: two Percent-of-monthly-total cells appear to have been adjusted so the row sums to 100.0 rather than strictly rounded - September union-shop is printed 61.3 (1,887/3,081 = 61.25) and November union-shop is printed 47.5 (992/2,091 = 47.44, which rounds to 47.4). Both are transcribed as printed. Similarly July percent-of-yearly-total unfair labor practice is printed 6.1 where 321/5,314 = 6.04.\n\nA small stray ink mark sits just above the comma in the Total row's \"25,874\"; it is not a footnote marker and has been ignored.
Source image
Source data: U.S. NLRB Annual Reports (public domain). Reconstruction by NLRB Stats Archive. Read by claude-opus-5 (effort max, prompt extract_v1) from the 300-dpi scan; stitched by page. Updated October 2026.