NLRB Stats Archive › Annual Reports › FY1949 › Monthly distribution of cases received
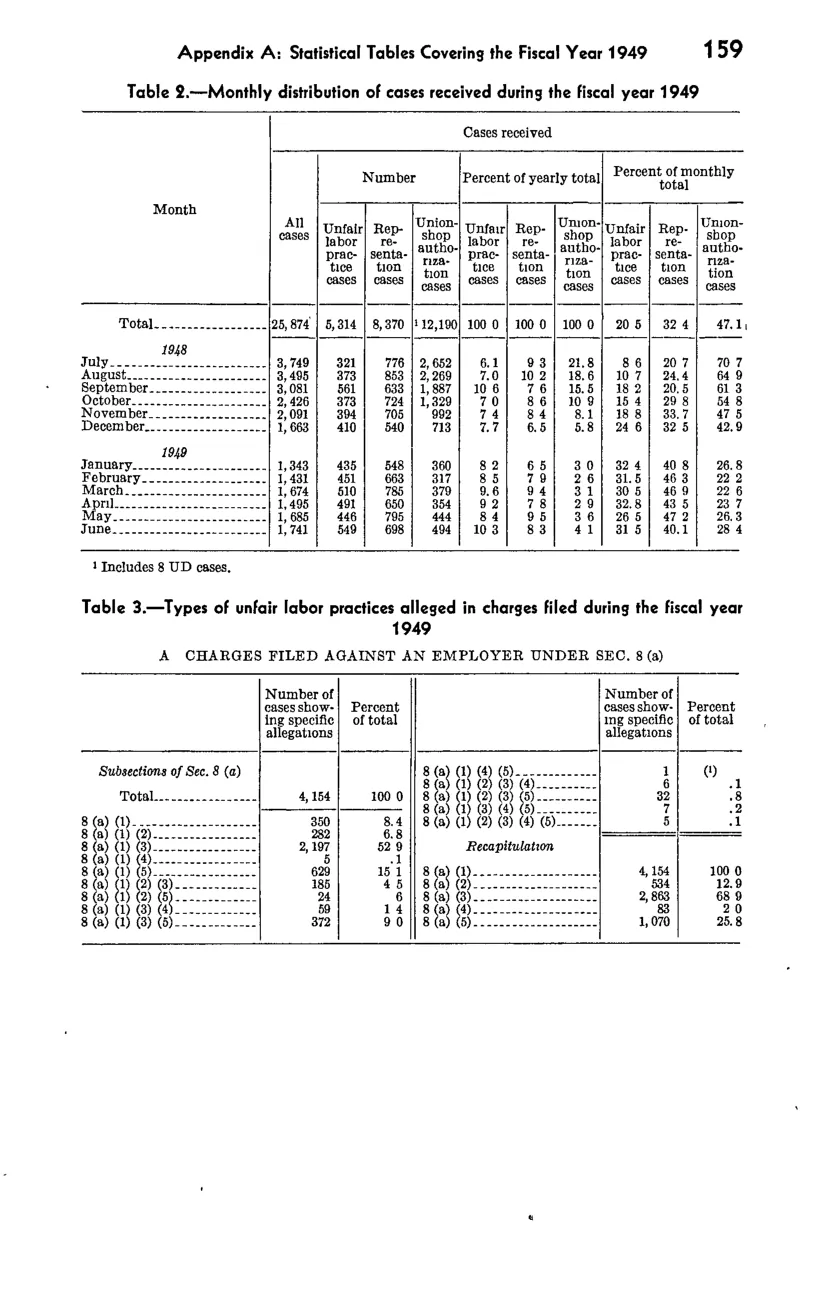
Monthly distribution of cases received
| Month | Number — All cases | Number — Unfair labor practice cases | Number — Representation cases | Number — Union-shop authorization cases | Percent of yearly total — Unfair labor practice cases | Percent of yearly total — Representation cases | Percent of yearly total — Union-shop authorization cases | Percent of monthly total — Unfair labor practice cases | Percent of monthly total — Representation cases | Percent of monthly total — Union-shop authorization cases |
|---|---|---|---|---|---|---|---|---|---|---|
| Total | 25,874 | 5,314 | 8,370 | 12,190 | 100 | 100 | 100 | 20.5 | 32.4 | 47.1 |
| 1948 — July | 3,749 | 321 | 776 | 2,652 | 6.1 | 9.3 | 21.8 | 8.6 | 20.7 | 70.7 |
| 1948 — August | 3,495 | 373 | 853 | 2,269 | 7 | 10.2 | 18.6 | 10.7 | 24.4 | 64.9 |
| 1948 — September | 3,081 | 561 | 633 | 1,887 | 10.6 | 7.6 | 15.5 | 18.2 | 20.5 | 61.3 |
| 1948 — October | 2,426 | 373 | 724 | 1,329 | 7 | 8.6 | 10.9 | 15.4 | 29.8 | 54.8 |
| 1948 — November | 2,091 | 394 | 705 | 992 | 7.4 | 8.4 | 8.1 | 18.8 | 33.7 | 47.5 |
| 1948 — December | 1,663 | 406 | 540 | 713 | 7.7 | 6.5 | 5.8 | 24.6 | 32.5 | 42.9 |
| 1949 — January | 1,343 | 435 | 548 | 360 | 8.2 | 6.5 | 3 | 32.4 | 40.8 | 26.8 |
| 1949 — February | 1,431 | 451 | 663 | 317 | 8.5 | 7.9 | 2.6 | 31.5 | 46.3 | 22.2 |
| 1949 — March | 1,674 | 510 | 785 | 379 | 9.6 | 9.4 | 3.1 | 30.5 | 46.9 | 22.6 |
| 1949 — April | 1,495 | 491 | 650 | 354 | 9.2 | 7.8 | 2.9 | 32.8 | 43.5 | 23.7 |
| 1949 — May | 1,685 | 446 | 795 | 444 | 8.4 | 9.5 | 3.6 | 26.5 | 47.2 | 26.3 |
| 1949 — June | 1,741 | 549 | 698 | 494 | 10.3 | 8.3 | 4.1 | 31.5 | 40.1 | 28.4 |
Source image
Source data: U.S. NLRB Annual Reports (public domain). Reconstruction by NLRB Stats Archive. Updated June 2026.