NLRB Stats Archive › Annual Reports › FY1948 › Geographic distribution of union-shop authorization elections, outcome, eligible voters, and valid votes cast during the fiscal year, 1948
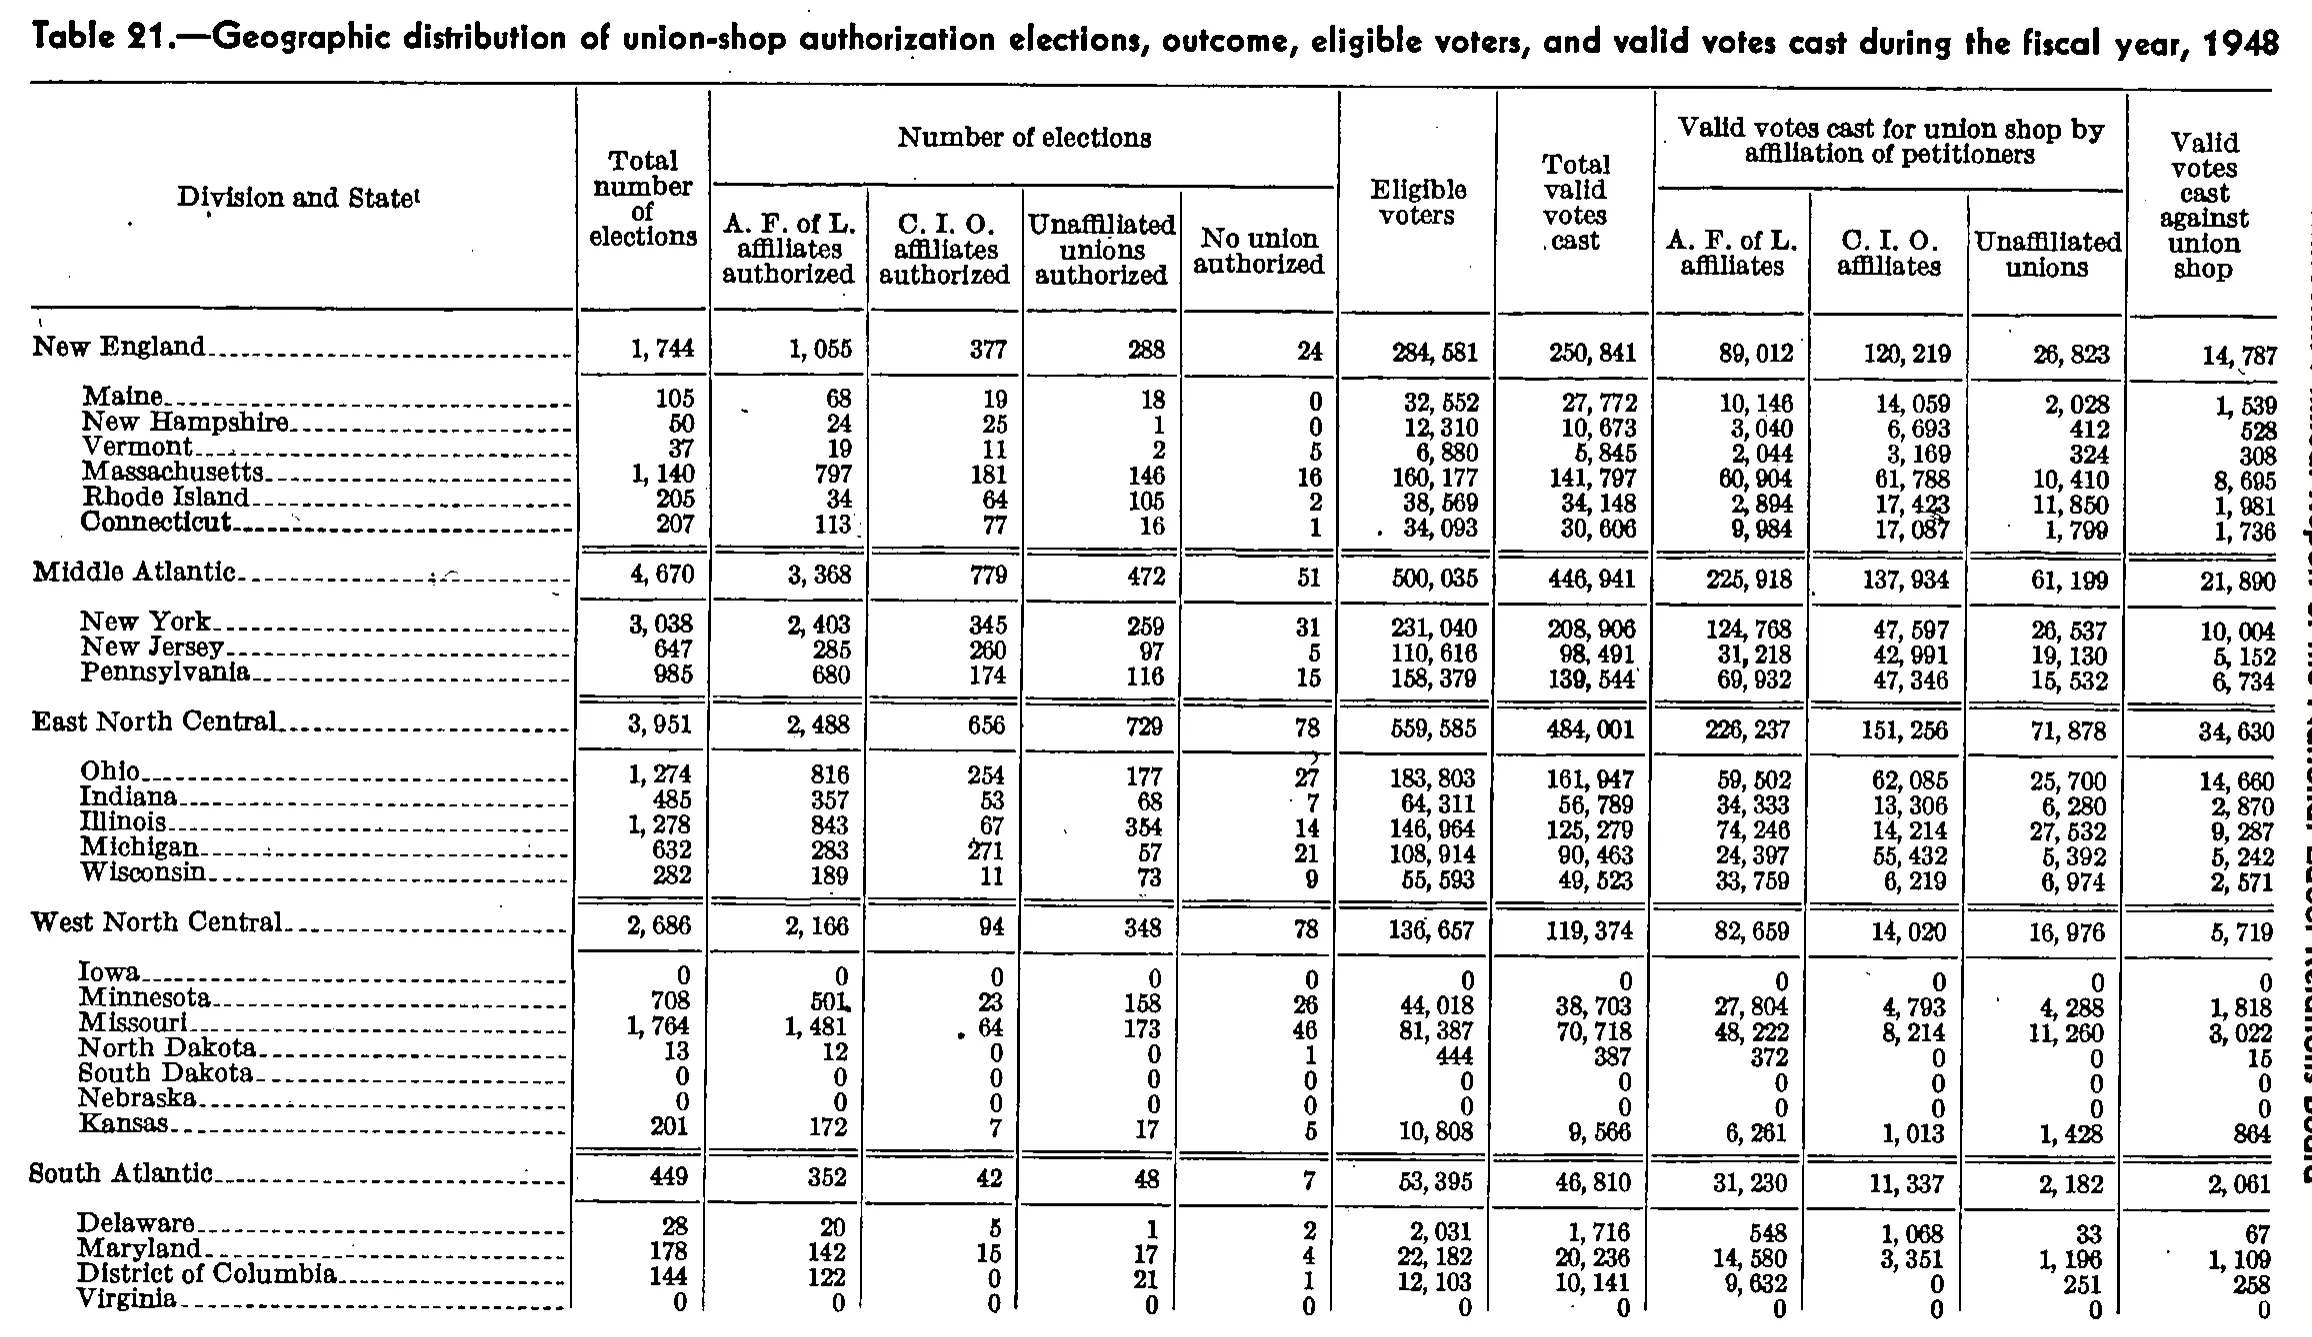
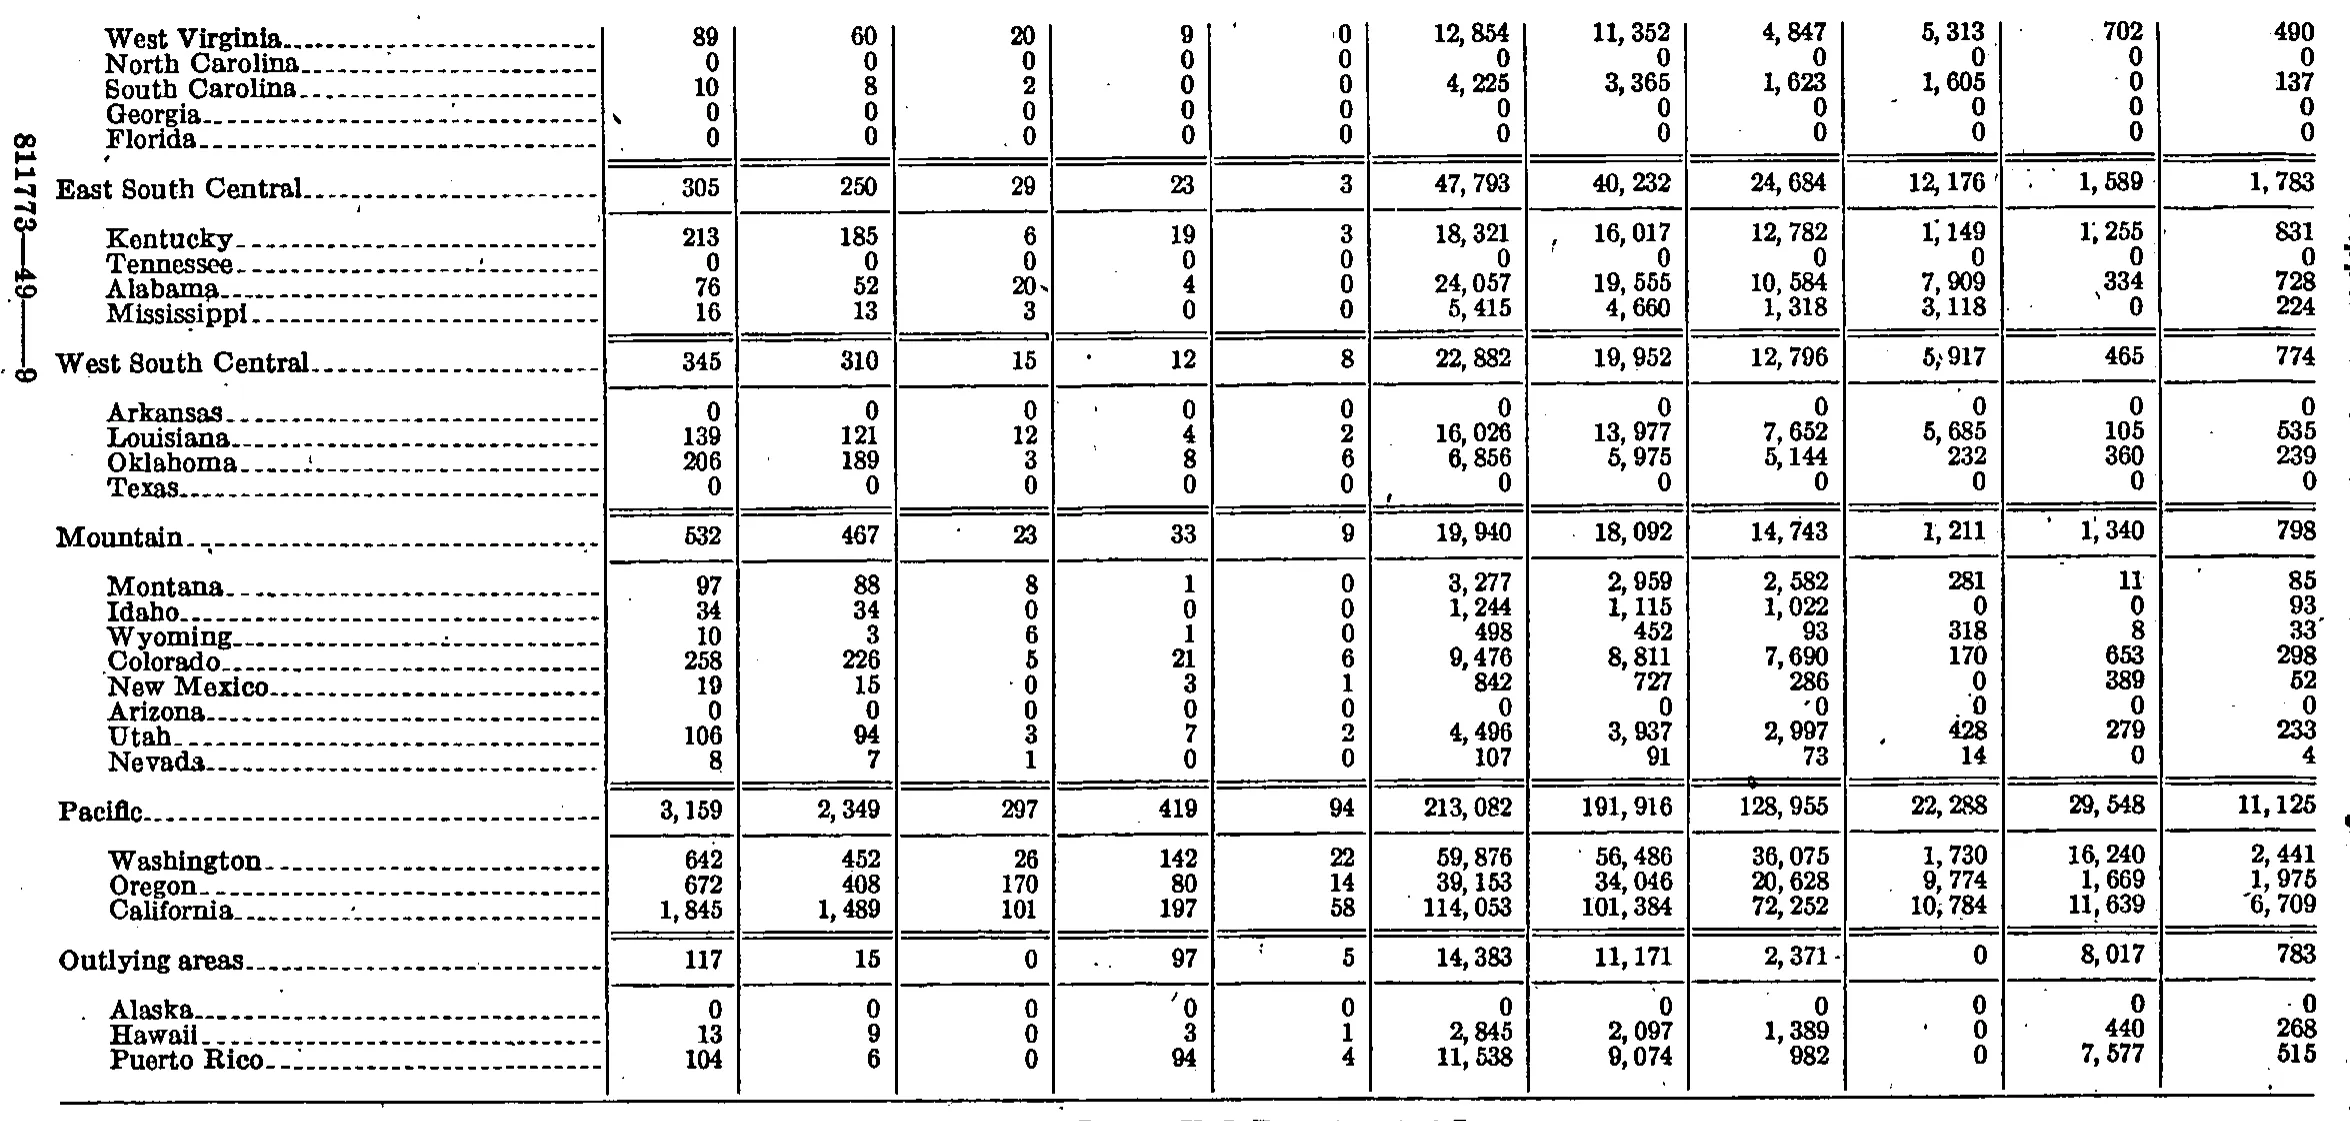
Geographic distribution of union-shop authorization elections, outcome, eligible voters, and valid votes cast during the fiscal year, 1948
Stitched from pp. 128–129.
| Division and State | Total number of elections | Number of elections | Eligible voters | Total valid votes cast | Valid votes cast for union shop by affiliation of petitioners | Valid votes cast against union shop | |||||
|---|---|---|---|---|---|---|---|---|---|---|---|
| Division and State | Total number of elections | A. F. of L. affiliates authorized | C. I. O. affiliates authorized | Unaffiliated unions authorized | No union authorized | Eligible voters | Total valid votes cast | A. F. of L. affiliates | C. I. O. affiliates | Unaffiliated unions | Valid votes cast against union shop |
| New England | 1,744 | 1,055 | 377 | 288 | 24 | 284,581 | 250,841 | 89,012 | 120,219 | 26,823 | 14,787 |
| Maine | 105 | 68 | 19 | 18 | 0 | 32,552 | 27,772 | 10,146 | 14,059 | 2,028 | 1,539 |
| New Hampshire | 50 | 24 | 25 | 1 | 0 | 12,310 | 10,673 | 3,040 | 6,693 | 412 | 528 |
| Vermont | 37 | 19 | 11 | 2 | 5 | 6,880 | 5,845 | 2,044 | 3,169 | 324 | 308 |
| Massachusetts | 1,140 | 797 | 181 | 146 | 16 | 160,177 | 141,797 | 60,904 | 61,788 | 10,410 | 8,695 |
| Rhode Island | 205 | 34 | 64 | 105 | 2 | 38,569 | 34,148 | 2,894 | 17,423 | 11,850 | 1,981 |
| Connecticut | 207 | 113 | 77 | 16 | 1 | 34,093 | 30,606 | 9,984 | 17,087 | 1,799 | 1,736 |
| Middle Atlantic | 4,670 | 3,368 | 779 | 472 | 51 | 500,035 | 446,941 | 225,918 | 137,934 | 61,199 | 21,890 |
| New York | 3,038 | 2,403 | 345 | 259 | 31 | 231,040 | 208,906 | 124,768 | 47,597 | 26,537 | 10,004 |
| New Jersey | 647 | 285 | 260 | 97 | 5 | 110,616 | 98,491 | 31,218 | 42,991 | 19,130 | 5,152 |
| Pennsylvania | 985 | 680 | 174 | 116 | 15 | 158,379 | 139,544 | 69,932 | 47,346 | 15,532 | 6,734 |
| East North Central | 3,951 | 2,488 | 656 | 729 | 78 | 559,585 | 484,001 | 226,237 | 151,256 | 71,878 | 34,630 |
| Ohio | 1,274 | 816 | 254 | 177 | 27 | 183,803 | 161,947 | 59,502 | 62,085 | 25,700 | 14,660 |
| Indiana | 485 | 357 | 53 | 68 | 7 | 64,311 | 56,789 | 34,333 | 13,306 | 6,280 | 2,870 |
| Illinois | 1,278 | 843 | 67 | 354 | 14 | 146,964 | 125,279 | 74,246 | 14,214 | 27,532 | 9,287 |
| Michigan | 632 | 283 | 271 | 57 | 21 | 108,914 | 90,463 | 24,397 | 55,432 | 5,392 | 5,242 |
| Wisconsin | 282 | 189 | 11 | 73 | 9 | 55,593 | 49,523 | 33,759 | 6,219 | 6,974 | 2,571 |
| West North Central | 2,686 | 2,166 | 94 | 348 | 78 | 136,657 | 119,374 | 82,659 | 14,020 | 16,976 | 5,719 |
| Iowa | 0 | 0 | 0 | 0 | 0 | 0 | 0 | 0 | 0 | 0 | 0 |
| Minnesota | 708 | 501 | 23 | 158 | 26 | 44,018 | 38,703 | 27,804 | 4,793 | 4,288 | 1,818 |
| Missouri | 1,764 | 1,481 | 64 | 173 | 46 | 81,387 | 70,718 | 48,222 | 8,214 | 11,260 | 3,022 |
| North Dakota | 13 | 12 | 0 | 0 | 1 | 444 | 387 | 372 | 0 | 0 | 15 |
| South Dakota | 0 | 0 | 0 | 0 | 0 | 0 | 0 | 0 | 0 | 0 | 0 |
| Nebraska | 0 | 0 | 0 | 0 | 0 | 0 | 0 | 0 | 0 | 0 | 0 |
| Kansas | 201 | 172 | 7 | 17 | 5 | 10,808 | 9,566 | 6,261 | 1,013 | 1,428 | 864 |
| South Atlantic | 449 | 352 | 42 | 48 | 7 | 53,395 | 46,810 | 31,230 | 11,337 | 2,182 | 2,061 |
| Delaware | 28 | 20 | 5 | 1 | 2 | 2,031 | 1,716 | 548 | 1,068 | 33 | 67 |
| Maryland | 178 | 142 | 15 | 17 | 4 | 22,182 | 20,236 | 14,580 | 3,351 | 1,196 | 1,109 |
| District of Columbia | 144 | 122 | 0 | 21 | 1 | 12,103 | 10,141 | 9,632 | 0 | 251 | 258 |
| Virginia | 0 | 0 | 0 | 0 | 0 | 0 | 0 | 0 | 0 | 0 | 0 |
| West Virginia | 89 | 60 | 20 | 9 | 0 | 12,854 | 11,352 | 4,847 | 5,313 | 702 | 490 |
| North Carolina | 0 | 0 | 0 | 0 | 0 | 0 | 0 | 0 | 0 | 0 | 0 |
| South Carolina | 10 | 8 | 2 | 0 | 0 | 4,225 | 3,365 | 1,623 | 1,605 | 0 | 137 |
| Georgia | 0 | 0 | 0 | 0 | 0 | 0 | 0 | 0 | 0 | 0 | 0 |
| Florida | 0 | 0 | 0 | 0 | 0 | 0 | 0 | 0 | 0 | 0 | 0 |
| East South Central | 305 | 250 | 29 | 23 | 3 | 47,793 | 40,232 | 24,684 | 12,176 | 1,589 | 1,783 |
| Kentucky | 213 | 185 | 6 | 19 | 3 | 18,321 | 16,017 | 12,782 | 1,149 | 1,255 | 831 |
| Tennessee | 0 | 0 | 0 | 0 | 0 | 0 | 0 | 0 | 0 | 0 | 0 |
| Alabama | 76 | 52 | 20 | 4 | 0 | 24,057 | 19,555 | 10,584 | 7,909 | 334 | 728 |
| Mississippi | 16 | 13 | 3 | 0 | 0 | 5,415 | 4,660 | 1,318 | 3,118 | 0 | 224 |
| West South Central | 345 | 310 | 15 | 12 | 8 | 22,882 | 19,952 | 12,796 | 5,917 | 465 | 774 |
| Arkansas | 0 | 0 | 0 | 0 | 0 | 0 | 0 | 0 | 0 | 0 | 0 |
| Louisiana | 139 | 121 | 12 | 4 | 2 | 16,026 | 13,977 | 7,652 | 5,685 | 105 | 535 |
| Oklahoma | 206 | 189 | 3 | 8 | 6 | 6,856 | 5,975 | 5,144 | 232 | 360 | 239 |
| Texas | 0 | 0 | 0 | 0 | 0 | 0 | 0 | 0 | 0 | 0 | 0 |
| Mountain | 532 | 467 | 23 | 33 | 9 | 19,940 | 18,092 | 14,743 | 1,211 | 1,340 | 798 |
| Montana | 97 | 88 | 8 | 1 | 0 | 3,277 | 2,959 | 2,582 | 281 | 11 | 85 |
| Idaho | 34 | 34 | 0 | 0 | 0 | 1,244 | 1,115 | 1,022 | 0 | 0 | 93 |
| Wyoming | 10 | 3 | 6 | 1 | 0 | 498 | 452 | 93 | 318 | 8 | 33 |
| Colorado | 258 | 226 | 5 | 21 | 6 | 9,476 | 8,811 | 7,690 | 170 | 653 | 298 |
| New Mexico | 19 | 15 | 0 | 3 | 1 | 842 | 727 | 286 | 0 | 389 | 52 |
| Arizona | 0 | 0 | 0 | 0 | 0 | 0 | 0 | 0 | 0 | 0 | 0 |
| Utah | 106 | 94 | 3 | 7 | 2 | 4,496 | 3,937 | 2,997 | 428 | 279 | 233 |
| Nevada | 8 | 7 | 1 | 0 | 0 | 107 | 91 | 73 | 14 | 0 | 4 |
| Pacific | 3,159 | 2,349 | 297 | 419 | 94 | 213,082 | 191,916 | 128,955 | 22,288 | 29,548 | 11,125 |
| Washington | 642 | 452 | 26 | 142 | 22 | 59,876 | 56,486 | 36,075 | 1,730 | 16,240 | 2,441 |
| Oregon | 672 | 408 | 170 | 80 | 14 | 39,153 | 34,046 | 20,628 | 9,774 | 1,669 | 1,975 |
| California | 1,845 | 1,489 | 101 | 197 | 58 | 114,053 | 101,384 | 72,252 | 10,784 | 11,639 | 6,709 |
| Outlying areas | 117 | 15 | 0 | 97 | 5 | 14,383 | 11,171 | 2,371 | 0 | 8,017 | 783 |
| Alaska | 0 | 0 | 0 | 0 | 0 | 0 | 0 | 0 | 0 | 0 | 0 |
| Hawaii | 13 | 9 | 0 | 3 | 1 | 2,845 | 2,097 | 1,389 | 0 | 440 | 268 |
| Puerto Rico | 104 | 6 | 0 | 94 | 4 | 11,538 | 9,074 | 982 | 0 | 7,577 | 515 |
516 of 516 figures sit in a row or column sum that works out.
Reader’s notes
p. 128. The crop ends in the middle of the South Atlantic division: the Virginia row is the last one printed and its baseline is clipped by the bottom edge of the image (all eleven of its cells read 0, but the digits are only partly visible). The remaining South Atlantic states and the later divisions, the table's total line and any footnote texts continue on the following page; the South Atlantic division line (449 elections) exceeds the sum of the four states shown here (350), as expected for a table continued beyond the crop. The stub heading carries a small raised marker after "State" (transcribed as "Division and State^1"); the marker is a thin mark at this resolution and could be a 1 or a dagger-like reference, and the footnote it points to is not printed within the crop. No arithmetic was altered. As a check on column placement, all four election-outcome columns sum to the printed "Total number of elections" and the three union-shop vote columns plus the "against" column sum to the printed "Total valid votes cast" for every state and division row, and the state rows sum to each division line, so the figures appear to sit under their correct columns. A rotated running head is printed in the right margin outside the table's rules; it is not transcribed.
p. 129. This crop is a continuation page: no column headings are printed on it, so header_rows is empty. The table has 12 columns (stub + 11 numeric), counted from the column rules; the first five rows (West Virginia through Florida) are the tail of a region whose heading row falls on the previous page, so the crop begins mid-section. Each region line (East South Central, West South Central, Mountain, Pacific, Outlying areas) is a total row printed above its member states, between double rules. All eleven columns of every region total agree exactly with the sum of the states listed beneath it, which corroborates the column assignment and the digits. The vertical text in the left margin ("81177 3-49--9") is a printer's signature mark, not table content, and is omitted. No footnotes are printed in the crop; a faint, largely cut-off line of type appears below the closing rule at the very bottom edge and could not be read, so it is not transcribed. Minor stray ink specks sit beside several cells (e.g. after Alabama's 20 in column 3, and beside Arizona's 0 in column 8); these read as scanner noise rather than footnote markers.
Source image
Source data: U.S. NLRB Annual Reports (public domain). Reconstruction by NLRB Stats Archive. Read by claude-opus-5 (effort max, prompt extract_v1) from the 300-dpi scan; stitched by page. Updated October 2026.