NLRB Stats Archive › Annual Reports › FY1948 › Geographic distribution of decertification elections, eligible voters, and number of votes cast for participating unions, during the fiscal year 1948
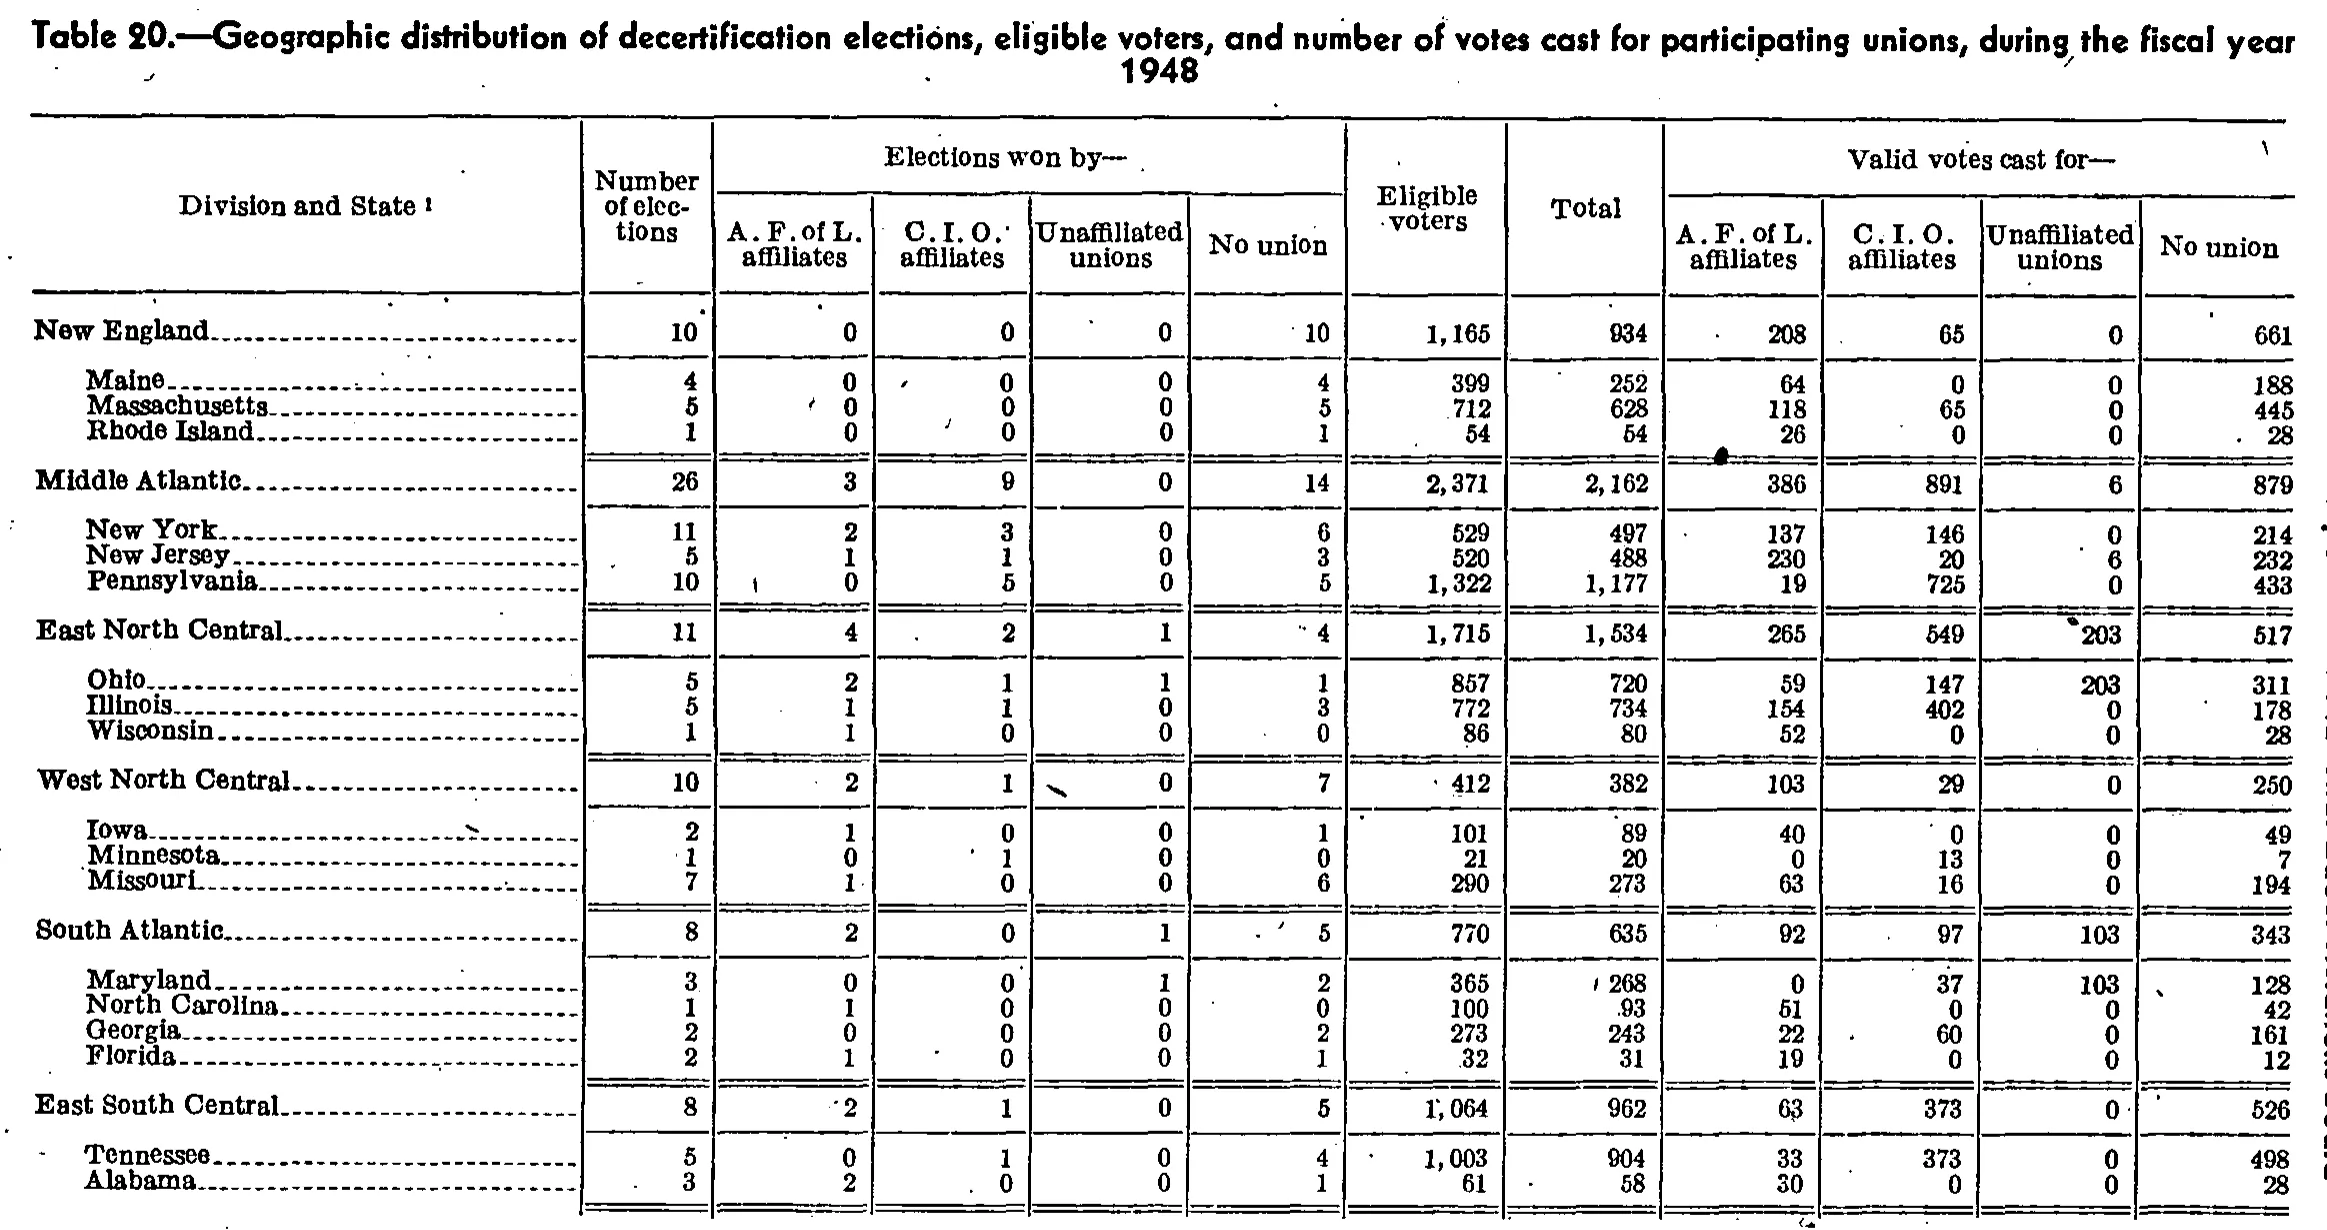
Geographic distribution of decertification elections, eligible voters, and number of votes cast for participating unions, during the fiscal year 1948
Stitched from pp. 126–127.
| Division and State | Number of elections | Elections won by— | Eligible voters | Total | Valid votes cast for— | ||||||
|---|---|---|---|---|---|---|---|---|---|---|---|
| Division and State | Number of elections | A. F. of L. affiliates | C. I. O. affiliates | Unaffiliated unions | No union | Eligible voters | Total | A. F. of L. affiliates | C. I. O. affiliates | Unaffiliated unions | No union |
| New England | 10 | 0 | 0 | 0 | 10 | 1,165 | 934 | 208 | 65 | 0 | 661 |
| Maine | 4 | 0 | 0 | 0 | 4 | 399 | 252 | 64 | 0 | 0 | 188 |
| Massachusetts | 5 | 0 | 0 | 0 | 5 | 712 | 628 | 118 | 65 | 0 | 445 |
| Rhode Island | 1 | 0 | 0 | 0 | 1 | 54 | 54 | 26 | 0 | 0 | 28 |
| Middle Atlantic | 26 | 3 | 9 | 0 | 14 | 2,371 | 2,162 | 386 | 891 | 6 | 879 |
| New York | 11 | 2 | 3 | 0 | 6 | 529 | 497 | 137 | 146 | 0 | 214 |
| New Jersey | 5 | 1 | 1 | 0 | 3 | 520 | 488 | 230 | 20 | 6 | 232 |
| Pennsylvania | 10 | 0 | 5 | 0 | 5 | 1,322 | 1,177 | 19 | 725 | 0 | 433 |
| East North Central | 11 | 4 | 2 | 1 | 4 | 1,715 | 1,534 | 265 | 549 | 203 | 517 |
| Ohio | 5 | 2 | 1 | 1 | 1 | 857 | 720 | 59 | 147 | 203 | 311 |
| Illinois | 5 | 1 | 1 | 0 | 3 | 772 | 734 | 154 | 402 | 0 | 178 |
| Wisconsin | 1 | 1 | 0 | 0 | 0 | 86 | 80 | 52 | 0 | 0 | 28 |
| West North Central | 10 | 2 | 1 | 0 | 7 | 412 | 382 | 103 | 29 | 0 | 250 |
| Iowa | 2 | 1 | 0 | 0 | 1 | 101 | 89 | 40 | 0 | 0 | 49 |
| Minnesota | 1 | 0 | 1 | 0 | 0 | 21 | 20 | 0 | 13 | 0 | 7 |
| Missouri | 7 | 1 | 0 | 0 | 6 | 290 | 273 | 63 | 16 | 0 | 194 |
| South Atlantic | 8 | 2 | 0 | 1 | 5 | 770 | 635 | 92 | 97 | 103 | 343 |
| Maryland | 3 | 0 | 0 | 1 | 2 | 365 | 268 | 0 | 37 | 103 | 128 |
| North Carolina | 1 | 1 | 0 | 0 | 0 | 100 | 93 | 51 | 0 | 0 | 42 |
| Georgia | 2 | 0 | 0 | 0 | 2 | 273 | 243 | 22 | 60 | 0 | 161 |
| Florida | 2 | 1 | 0 | 0 | 1 | 32 | 31 | 19 | 0 | 0 | 12 |
| East South Central | 8 | 2 | 1 | 0 | 5 | 1,064 | 962 | 63 | 373 | 0 | 526 |
| Tennessee | 5 | 0 | 1 | 0 | 4 | 1,003 | 904 | 33 | 373 | 0 | 498 |
| Alabama | 3 | 2 | 0 | 0 | 1 | 61 | 58 | 30 | 0 | 0 | 28 |
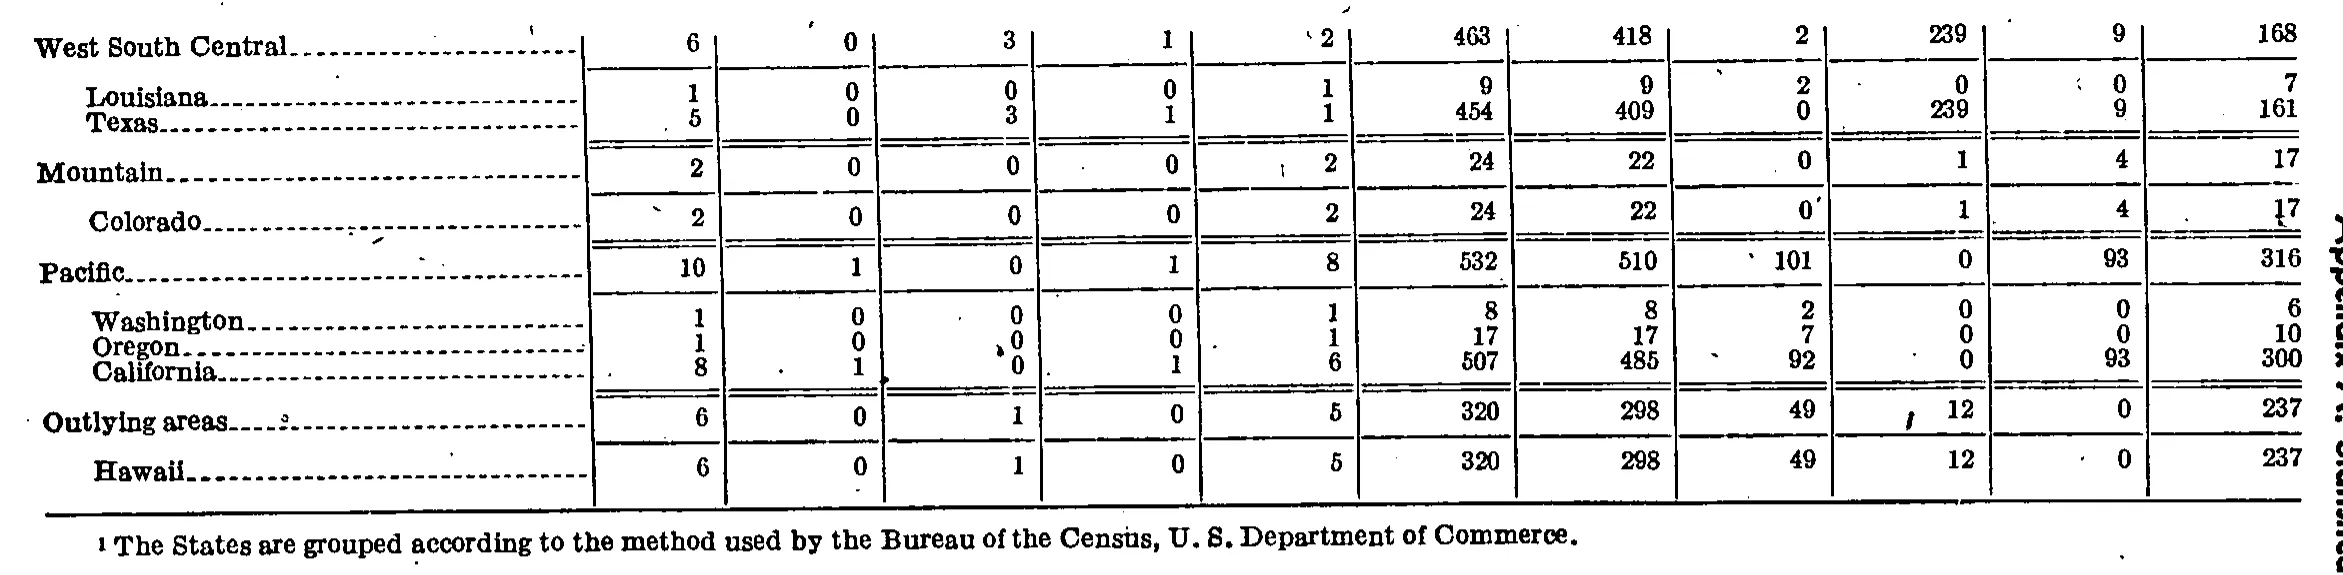
| West South Central | 6 | 0 | 3 | 1 | 2 | 463 | 418 | 2 | 239 | 9 | 168 |
| Louisiana | 1 | 0 | 0 | 0 | 1 | 9 | 9 | 2 | 0 | 0 | 7 |
| Texas | 5 | 0 | 3 | 1 | 1 | 454 | 409 | 0 | 239 | 9 | 161 |
| Mountain | 2 | 0 | 0 | 0 | 2 | 24 | 22 | 0 | 1 | 4 | 17 |
| Colorado | 2 | 0 | 0 | 0 | 2 | 24 | 22 | 0 | 1 | 4 | 17 |
| Pacific | 10 | 1 | 0 | 1 | 8 | 532 | 510 | 101 | 0 | 93 | 316 |
| Washington | 1 | 0 | 0 | 0 | 1 | 8 | 8 | 2 | 0 | 0 | 6 |
| Oregon | 1 | 0 | 0 | 0 | 1 | 17 | 17 | 7 | 0 | 0 | 10 |
| California | 8 | 1 | 0 | 1 | 6 | 507 | 485 | 92 | 0 | 93 | 300 |
| Outlying areas | 6 | 0 | 1 | 0 | 5 | 320 | 298 | 49 | 12 | 0 | 237 |
| Hawaii | 6 | 0 | 1 | 0 | 5 | 320 | 298 | 49 | 12 | 0 | 237 |
- 1 The States are grouped according to the method used by the Bureau of the Census, U. S. Department of Commerce.
273 of 277 figures sit in a row or column sum that works out.
Reader’s notes
p. 126. Crop is cut off at the bottom: the table clearly continues past the last visible row (Alabama) — the remaining census divisions (West South Central, Mountain, Pacific) and any United States total row are not on this image, and the text of footnote 1 (marker printed on the stub heading "Division and State") is also below the crop, so `footnotes` is empty. Column structure: 12 columns. "Elections won by—" spans columns 3-6; "Valid votes cast for—" spans columns 9-12. "Eligible voters" and "Total" are each a tall single heading standing between the two spanner groups (the rule under "Valid votes cast for—" begins to the right of the Total column), so neither sits under a spanner. The "Total" column is the total of the four "Valid votes cast for—" columns (e.g. New England 208+65+0+661 = 934). Scan speckle, not part of the values: a stray mark precedes "268" in Maryland/Total, a stray mark precedes "93" in North Carolina/Total (the value is 93, not .93), a stray mark precedes "203" in East North Central/Valid votes cast for—Unaffiliated unions, and an ink blot sits left of "26" in Rhode Island/Valid votes cast for—A. F. of L. affiliates. None of these were transcribed. All division subtotals verified against their listed States and every one adds correctly; no misprints detected.
p. 127. This crop is the tail end of a table continued from an earlier page: no column headings are printed on the image, so header_rows is empty. Counting the vertical column rules gives 12 columns (stub + 11 numeric), and every body row carries a value in all 11 numeric columns. Structure: regional group lines (West South Central, Mountain, Pacific, Outlying areas) are set flush left, with their constituent States indented beneath; group totals equal the sum of the indented States in every column, which supports the column assignments. The scan carries scattered ink specks and stray tick marks that are not part of the data — e.g. a speck before the "2" in the West South Central row (column 5), before the "2" in the Mountain row (column 5), a mark before "0" in the Louisiana row (column 10), an apostrophe-like tick after "0" in the Colorado row (column 8) and before "101" in the Pacific row (column 8), a mark before "12" in the Outlying areas row (column 9), and a small comma-like mark under the Hawaii row. None were read as footnote markers or digits. The Colorado row's last cell (column 11) is partly broken by a speck but reads 17, matching the Mountain group line above it. The right edge of the image shows vertical running-head text ("Appendix A.—Statistics" or similar) outside the table rule; it is not transcribed.
Source image
Source data: U.S. NLRB Annual Reports (public domain). Reconstruction by NLRB Stats Archive. Read by claude-opus-5 (effort max, prompt extract_v1) from the 300-dpi scan; stitched by page. Updated October 2026.