NLRB Stats Archive › Annual Reports › FY1948 › Geographic distribution of collective bargaining elections, eligible voters, and number of votes cast for participating unions during the fiscal year 1948
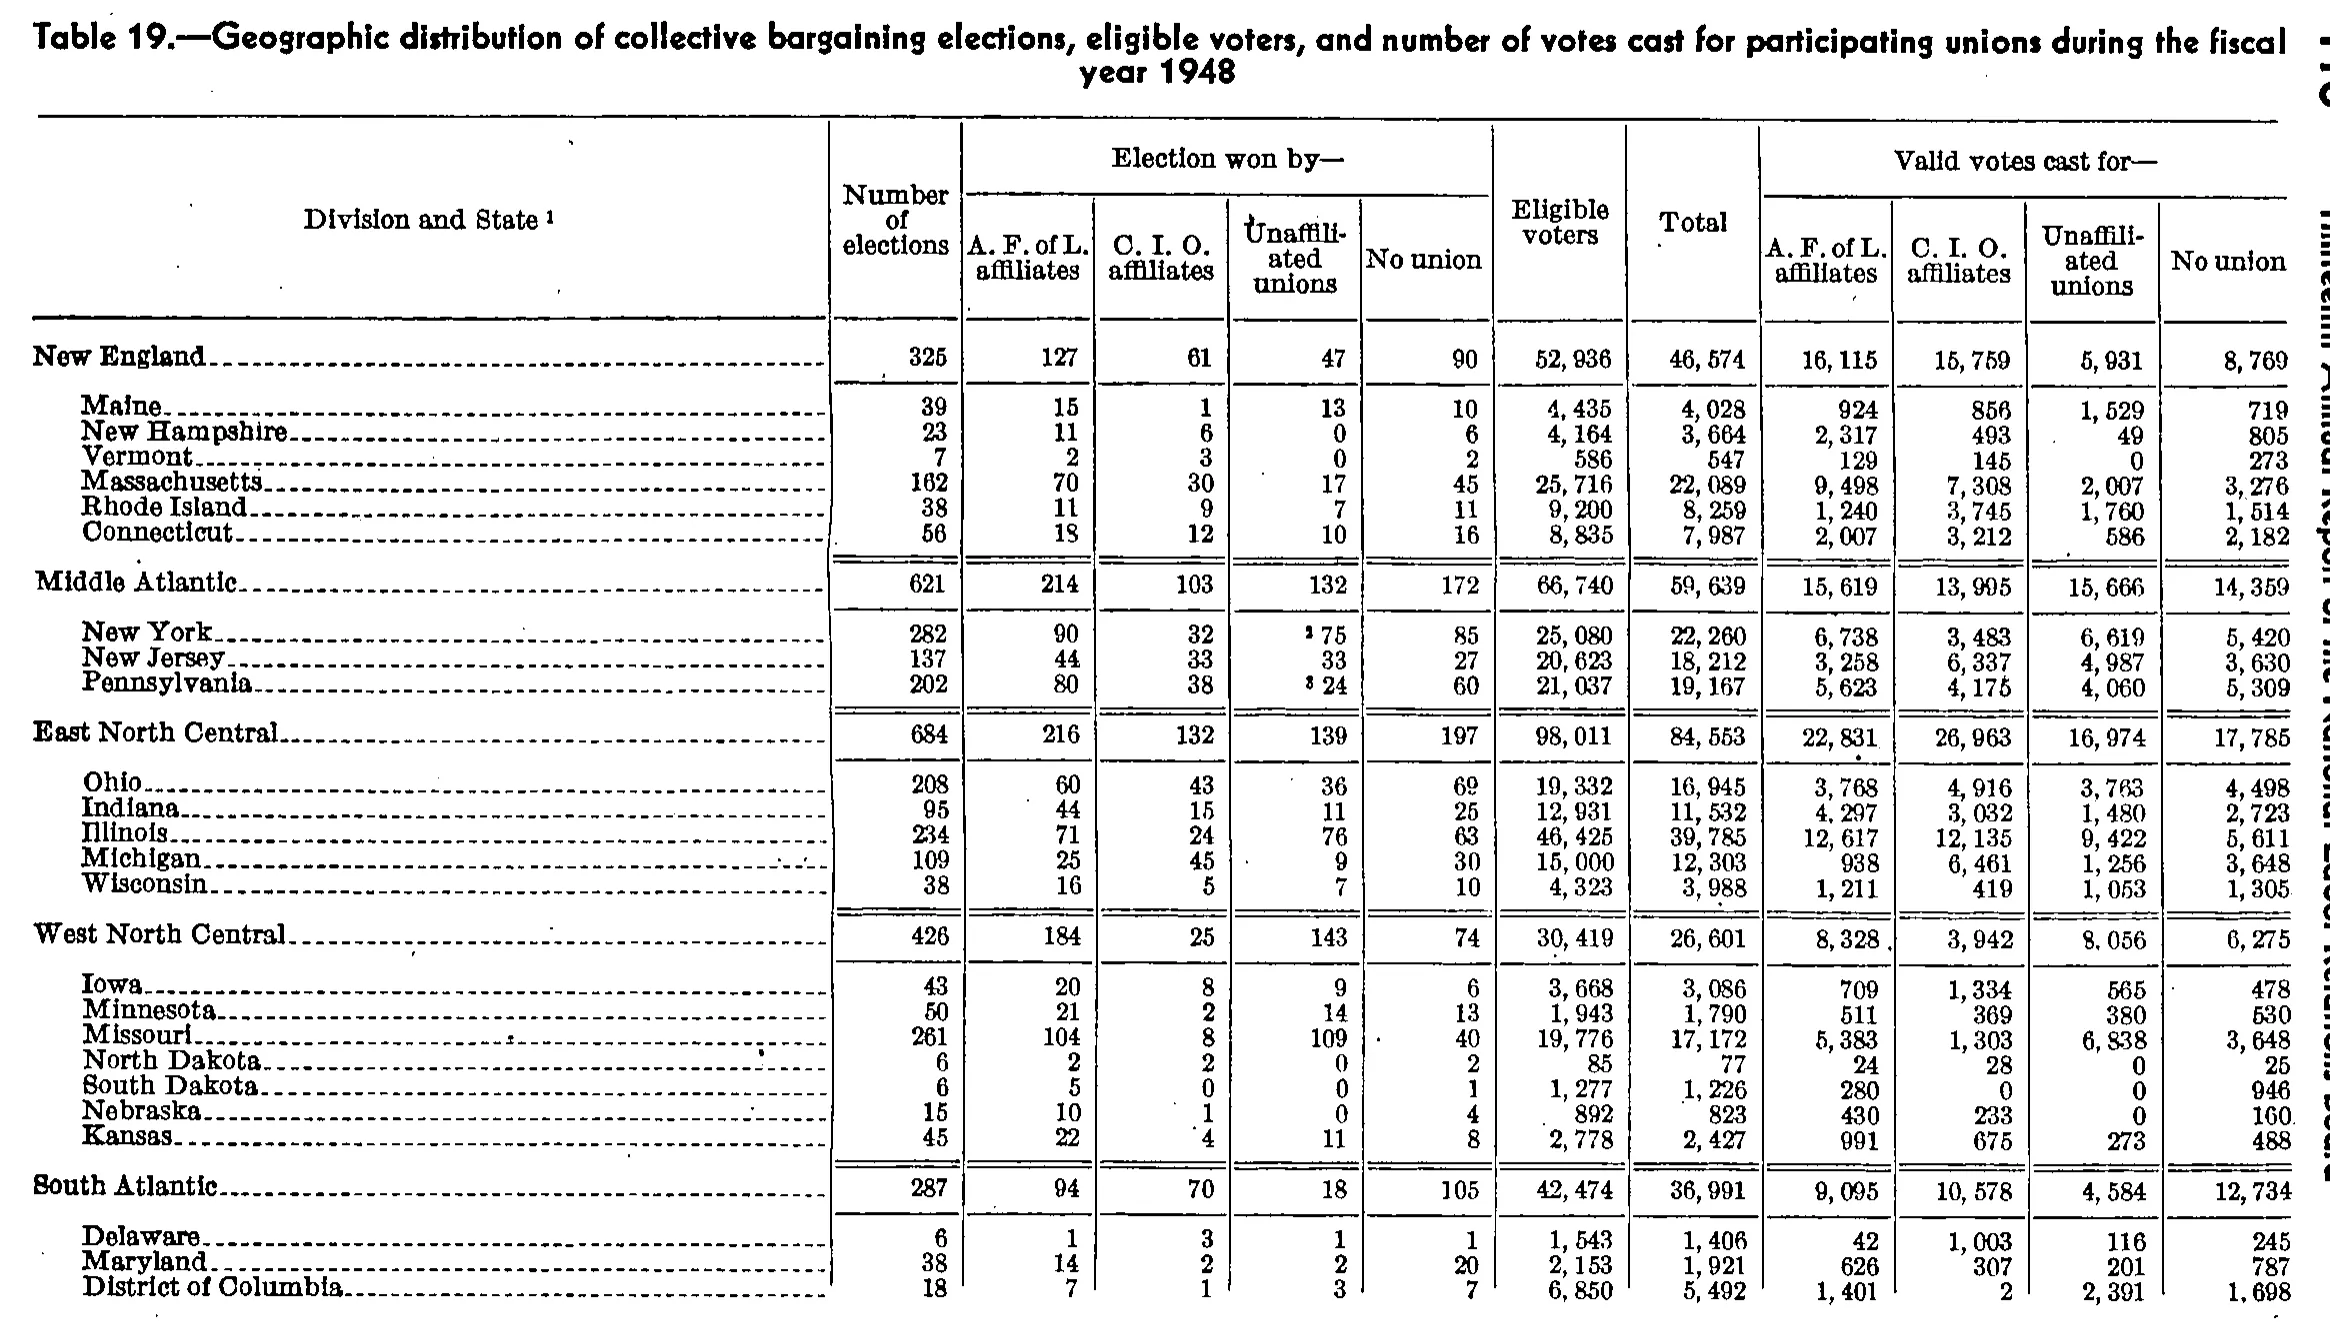
Geographic distribution of collective bargaining elections, eligible voters, and number of votes cast for participating unions during the fiscal year 1948
Stitched from pp. 124–125.
| Division and State | Number of elections | Election won by— | Eligible voters | Total | Valid votes cast for— | ||||||
|---|---|---|---|---|---|---|---|---|---|---|---|
| Division and State | Number of elections | A. F. of L. affiliates | C. I. O. affiliates | Unaffiliated unions | No union | Eligible voters | Total | A. F. of L. affiliates | C. I. O. affiliates | Unaffiliated unions | No union |
| New England | 325 | 127 | 61 | 47 | 90 | 52,936 | 46,574 | 16,115 | 15,759 | 5,931 | 8,769 |
| Maine | 39 | 15 | 1 | 13 | 10 | 4,435 | 4,028 | 924 | 856 | 1,529 | 719 |
| New Hampshire | 23 | 11 | 6 | 0 | 6 | 4,164 | 3,664 | 2,317 | 493 | 49 | 805 |
| Vermont | 7 | 2 | 3 | 0 | 2 | 586 | 547 | 129 | 145 | 0 | 273 |
| Massachusetts | 162 | 70 | 30 | 17 | 45 | 25,716 | 22,089 | 9,498 | 7,308 | 2,007 | 3,276 |
| Rhode Island | 38 | 11 | 9 | 7 | 11 | 9,200 | 8,259 | 1,240 | 3,745 | 1,760 | 1,514 |
| Connecticut | 56 | 18 | 12 | 10 | 16 | 8,835 | 7,987 | 2,007 | 3,212 | 586 | 2,182 |
| Middle Atlantic | 621 | 214 | 103 | 132 | 172 | 66,740 | 59,639 | 15,619 | 13,995 | 15,666 | 14,359 |
| New York | 282 | 90 | 32 | 75 | 85 | 25,080 | 22,260 | 6,738 | 3,483 | 6,619 | 5,420 |
| New Jersey | 137 | 44 | 33 | 33 | 27 | 20,623 | 18,212 | 3,258 | 6,337 | 4,987 | 3,630 |
| Pennsylvania | 202 | 80 | 38 | 24 | 60 | 21,037 | 19,167 | 5,623 | 4,175 | 4,060 | 5,309 |
| East North Central | 684 | 216 | 132 | 139 | 197 | 98,011 | 84,553 | 22,831 | 26,963 | 16,974 | 17,785 |
| Ohio | 208 | 60 | 43 | 36 | 69 | 19,332 | 16,945 | 3,768 | 4,916 | 3,763 | 4,498 |
| Indiana | 95 | 44 | 15 | 11 | 25 | 12,931 | 11,532 | 4,297 | 3,032 | 1,480 | 2,723 |
| Illinois | 234 | 71 | 24 | 76 | 63 | 46,425 | 39,785 | 12,617 | 12,135 | 9,422 | 5,611 |
| Michigan | 109 | 25 | 45 | 9 | 30 | 15,000 | 12,303 | 938 | 6,461 | 1,256 | 3,648 |
| Wisconsin | 38 | 16 | 5 | 7 | 10 | 4,323 | 3,988 | 1,211 | 419 | 1,053 | 1,305 |
| West North Central | 426 | 184 | 25 | 143 | 74 | 30,419 | 26,601 | 8,328 | 3,942 | 8,056 | 6,275 |
| Iowa | 43 | 20 | 8 | 9 | 6 | 3,668 | 3,086 | 709 | 1,334 | 565 | 478 |
| Minnesota | 50 | 21 | 2 | 14 | 13 | 1,943 | 1,790 | 511 | 369 | 380 | 530 |
| Missouri | 261 | 104 | 8 | 109 | 40 | 19,776 | 17,172 | 5,383 | 1,303 | 6,838 | 3,648 |
| North Dakota | 6 | 2 | 2 | 0 | 2 | 85 | 77 | 24 | 28 | 0 | 25 |
| South Dakota | 6 | 5 | 0 | 0 | 1 | 1,277 | 1,226 | 280 | 0 | 0 | 946 |
| Nebraska | 15 | 10 | 1 | 0 | 4 | 892 | 823 | 430 | 233 | 0 | 160 |
| Kansas | 45 | 22 | 4 | 11 | 8 | 2,778 | 2,427 | 991 | 675 | 273 | 488 |
| South Atlantic | 287 | 94 | 70 | 18 | 105 | 42,474 | 36,991 | 9,095 | 10,578 | 4,584 | 12,734 |
| Delaware | 6 | 1 | 3 | 1 | 1 | 1,543 | 1,406 | 42 | 1,003 | 116 | 245 |
| Maryland | 38 | 14 | 2 | 2 | 20 | 2,153 | 1,921 | 626 | 307 | 201 | 787 |
| District of Columbia | 18 | 7 | 1 | 3 | 7 | 6,850 | 5,492 | 1,401 | 2 | 2,391 | 1,698 |
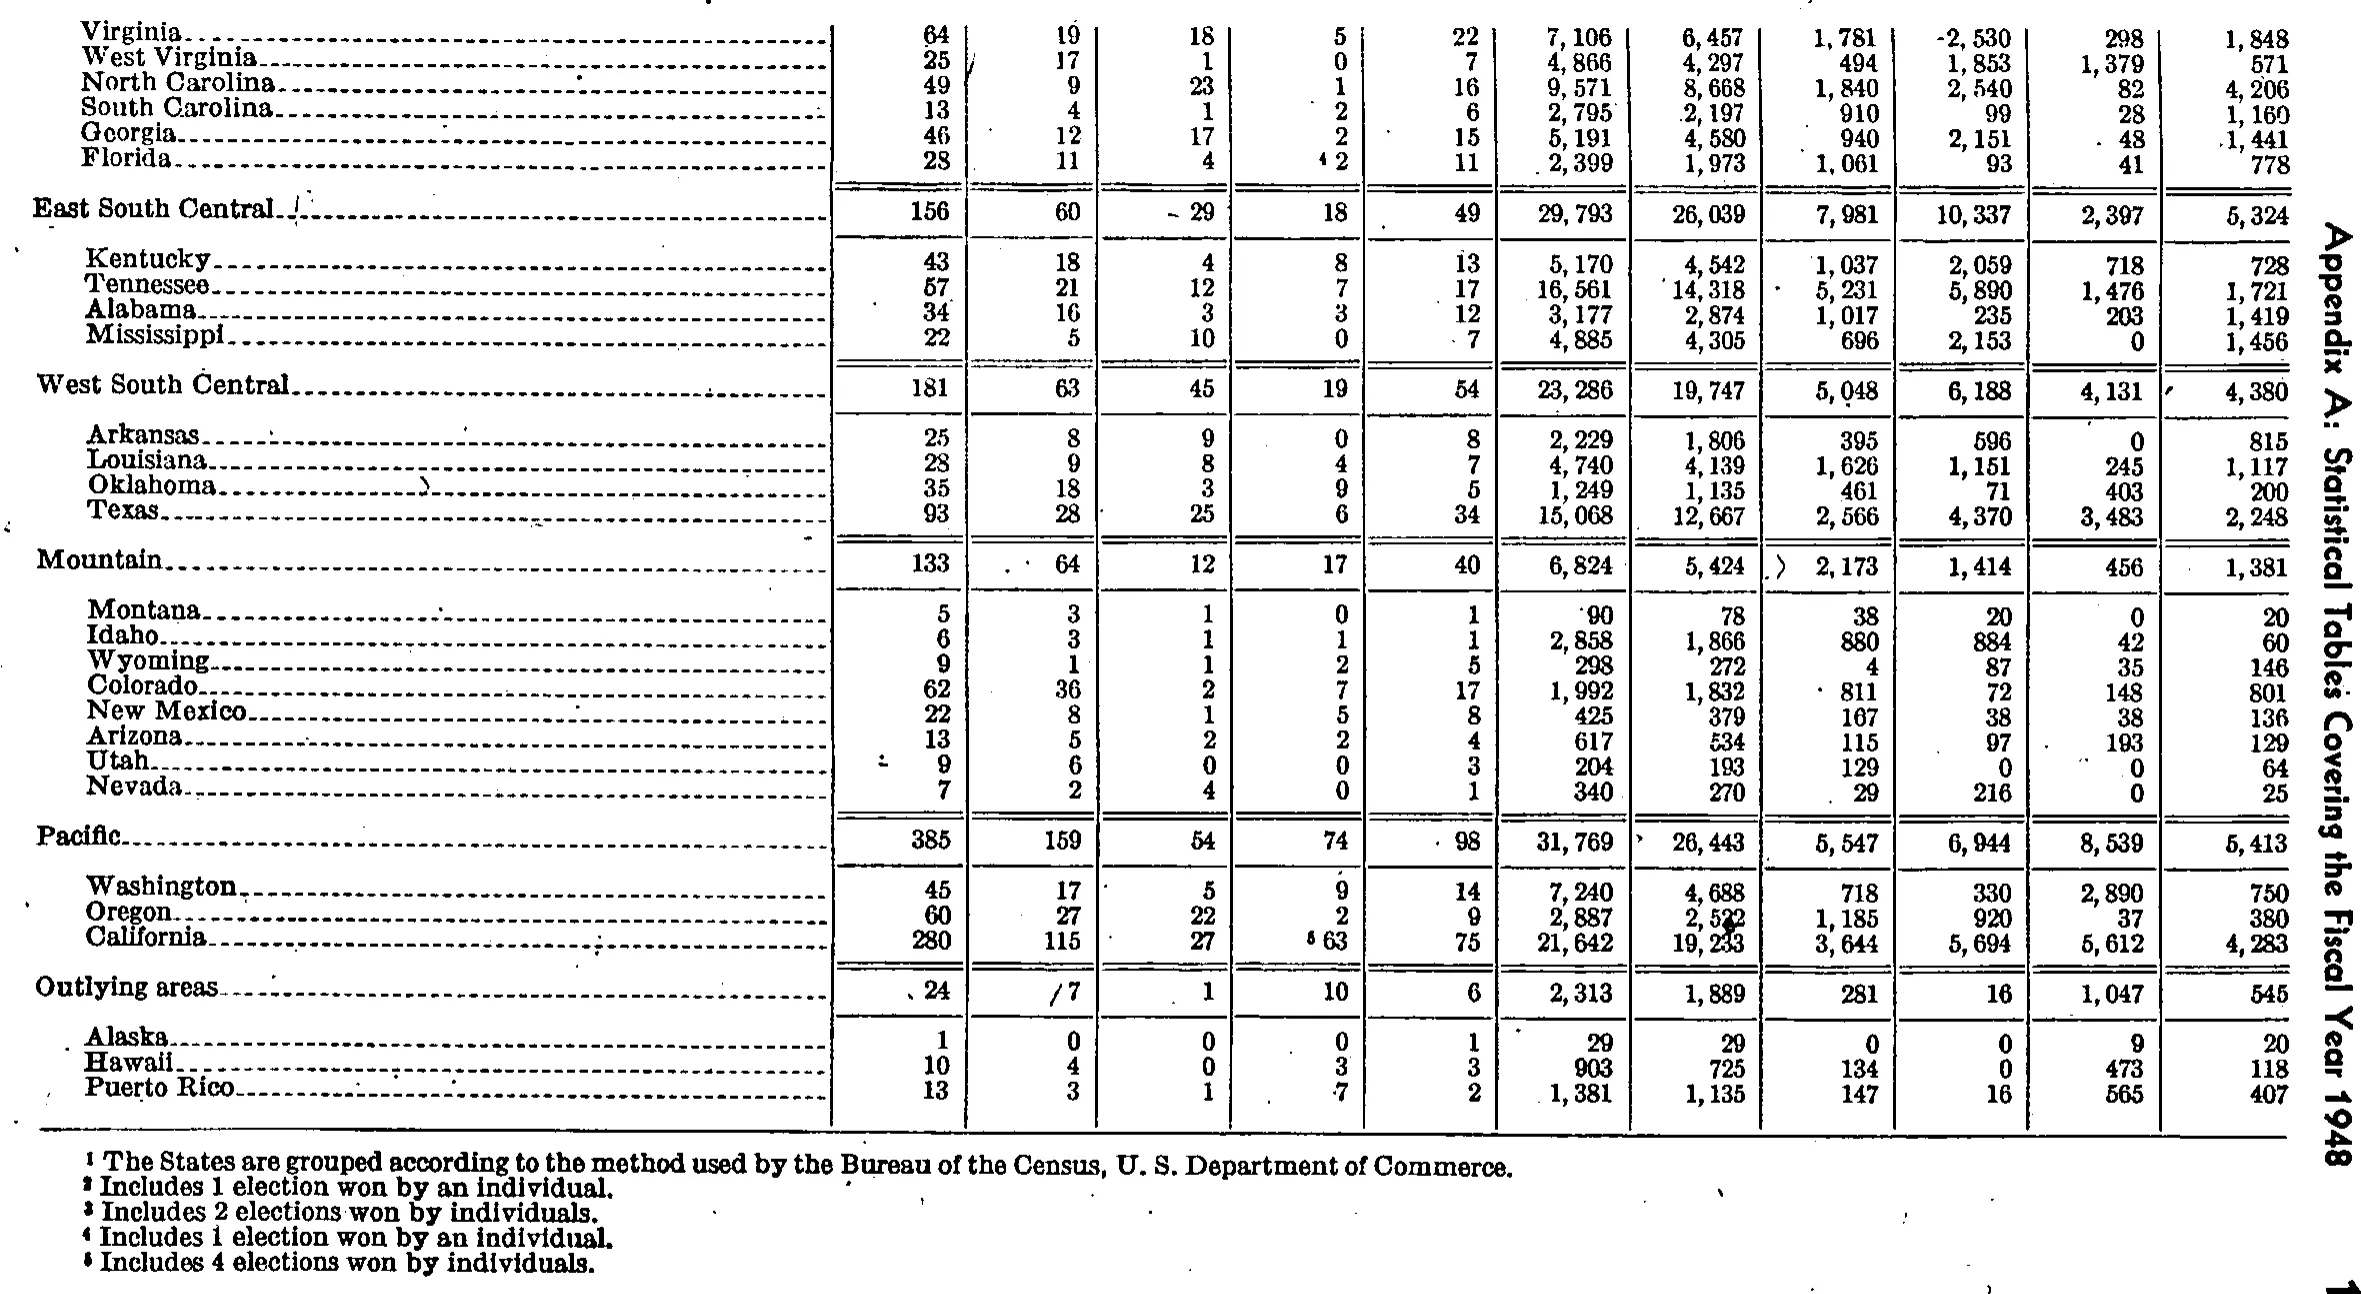
| Virginia | 64 | 19 | 18 | 5 | 22 | 7,106 | 6,457 | 1,781 | 2,530 | 298 | 1,848 |
| West Virginia | 25 | 17 | 1 | 0 | 7 | 4,866 | 4,297 | 494 | 1,853 | 1,379 | 571 |
| North Carolina | 49 | 9 | 23 | 1 | 16 | 9,571 | 8,668 | 1,840 | 2,540 | 82 | 4,206 |
| South Carolina | 13 | 4 | 1 | 2 | 6 | 2,795 | 2,197 | 910 | 99 | 28 | 1,160 |
| Georgia | 46 | 12 | 17 | 2 | 15 | 5,191 | 4,580 | 940 | 2,151 | 48 | 1,441 |
| Florida | 28 | 11 | 4 | 2 | 11 | 2,399 | 1,973 | 1,061 | 93 | 41 | 778 |
| East South Central | 156 | 60 | 29 | 18 | 49 | 29,793 | 26,039 | 7,981 | 10,337 | 2,397 | 5,324 |
| Kentucky | 43 | 18 | 4 | 8 | 13 | 5,170 | 4,542 | 1,037 | 2,059 | 718 | 728 |
| Tennessee | 57 | 21 | 12 | 7 | 17 | 16,561 | 14,318 | 5,231 | 5,890 | 1,476 | 1,721 |
| Alabama | 34 | 16 | 3 | 3 | 12 | 3,177 | 2,874 | 1,017 | 235 | 203 | 1,419 |
| Mississippi | 22 | 5 | 10 | 0 | 7 | 4,885 | 4,305 | 696 | 2,153 | 0 | 1,456 |
| West South Central | 181 | 63 | 45 | 19 | 54 | 23,286 | 19,747 | 5,048 | 6,188 | 4,131 | 4,380 |
| Arkansas | 25 | 8 | 9 | 0 | 8 | 2,229 | 1,806 | 395 | 596 | 0 | 815 |
| Louisiana | 28 | 9 | 8 | 4 | 7 | 4,740 | 4,139 | 1,626 | 1,151 | 245 | 1,117 |
| Oklahoma | 35 | 18 | 3 | 9 | 5 | 1,249 | 1,135 | 461 | 71 | 403 | 200 |
| Texas | 93 | 28 | 25 | 6 | 34 | 15,068 | 12,667 | 2,566 | 4,370 | 3,483 | 2,248 |
| Mountain | 133 | 64 | 12 | 17 | 40 | 6,824 | 5,424 | 2,173 | 1,414 | 456 | 1,381 |
| Montana | 5 | 3 | 1 | 0 | 1 | 90 | 78 | 38 | 20 | 0 | 20 |
| Idaho | 6 | 3 | 1 | 1 | 1 | 2,858 | 1,866 | 880 | 884 | 42 | 60 |
| Wyoming | 9 | 1 | 1 | 2 | 5 | 298 | 272 | 4 | 87 | 35 | 146 |
| Colorado | 62 | 36 | 2 | 7 | 17 | 1,992 | 1,832 | 811 | 72 | 148 | 801 |
| New Mexico | 22 | 8 | 1 | 5 | 8 | 425 | 379 | 167 | 38 | 38 | 136 |
| Arizona | 13 | 5 | 2 | 2 | 4 | 617 | 534 | 115 | 97 | 193 | 129 |
| Utah | 9 | 6 | 0 | 0 | 3 | 204 | 193 | 129 | 0 | 0 | 64 |
| Nevada | 7 | 2 | 4 | 0 | 1 | 340 | 270 | 29 | 216 | 0 | 25 |
| Pacific | 385 | 159 | 54 | 74 | 98 | 31,769 | 26,443 | 5,547 | 6,944 | 8,539 | 5,413 |
| Washington | 45 | 17 | 5 | 9 | 14 | 7,240 | 4,688 | 718 | 330 | 2,890 | 750 |
| Oregon | 60 | 27 | 22 | 2 | 9 | 2,887 | 2,522 | 1,185 | 920 | 37 | 380 |
| California | 280 | 115 | 27 | 63 | 75 | 21,642 | 19,233 | 3,644 | 5,694 | 5,612 | 4,283 |
| Outlying areas | 24 | 7 | 1 | 10 | 6 | 2,313 | 1,889 | 281 | 16 | 1,047 | 545 |
| Alaska | 1 | 0 | 0 | 0 | 1 | 29 | 29 | 0 | 0 | 9 | 20 |
| Hawaii | 10 | 4 | 0 | 3 | 3 | 903 | 725 | 134 | 0 | 473 | 118 |
| Puerto Rico | 13 | 3 | 1 | 7 | 2 | 1,381 | 1,135 | 147 | 16 | 565 | 407 |
- 1 The States are grouped according to the method used by the Bureau of the Census, U. S. Department of Commerce.
- 2 Includes 1 election won by an individual.
- 3 Includes 2 elections won by individuals.
- 4 Includes 1 election won by an individual.
- 5 Includes 4 elections won by individuals.
651 of 651 figures sit in a row or column sum that works out.
Reader’s notes
p. 124. The crop ends in the middle of the table: the South Atlantic division breaks off after "District of Columbia" (the remaining South Atlantic States and all later divisions, plus any U.S. total row, continue below the crop). No footnote texts are printed on this crop, so `footnotes` is empty even though markers 1, 2 and 3 appear in the body. Footnote markers: the stub heading carries a raised 1 ("Division and State^1"). Two raised digits are printed to the LEFT of the value in the "Election won by—: Unaffiliated unions" column — on the New York row before 75 and on the Pennsylvania row before 24. Both glyphs are small and partly broken in the scan; I read them as 2 (New York) and 3 (Pennsylvania) on the basis of reading order, but they could both be the same digit, and I cannot check them against footnote text because it is cut off. The digits are certainly markers and not part of the numbers: 90+32+75+85 = 282 and 80+38+24+60 = 202 reproduce those rows' printed election counts exactly. Verification: every division subtotal and every row's four vote components were checked against the printed totals, and all of them agree, including the unusual-looking small values — District of Columbia C. I. O. affiliates = 2 (1,401+2+2,391+1,698 = 5,492 as printed) and Michigan A. F. of L. affiliates = 938. Several cells are typeset with a space after the digit-grouping comma or with the comma printed faintly as a period ("8. 056" for West North Central / Unaffiliated unions valid votes, "5, 931", "59, 639"); these were normalized to commas, and 8,056 is confirmed by its column sum (565+380+6,838+0+0+0+273). Column structure: 12 columns. "Number of elections", "Eligible voters" and "Total" are tall single headings spanning both heading levels and sit outside the two spanners; "Election won by—" spans the four columns after "Number of elections", and "Valid votes cast for—" spans the last four. "Total" is the total of valid votes cast (it equals the sum of the last four columns), but it is printed to the left of, and outside, the "Valid votes cast for—" spanner rule, so it is recorded as its own heading. Division rows (New England, Middle Atlantic, East North Central, West North Central, South Atlantic) are set flush left and carry values; the State rows are indented under them. The vertical running head along the right edge of the page was excluded.
p. 125. Continuation page: no column headings are printed on this crop, so header_rows is empty. The grid has 12 columns (stub + 11 data columns), counted from the column rules. Structure: each regional total row (East South Central, West South Central, Mountain, Pacific, Outlying areas) is printed ABOVE the member States it covers, separated by double rules. The six States at the top (Virginia through Florida) belong to a region (South Atlantic) whose total row falls on the preceding page, which is cut off above this crop; only a fragment of the rule above the Virginia line is visible. I verified each regional total against the sum of its member States in all 11 columns; every one of the five regions balances exactly, which confirms the digits and the column each value sits in. The top six State rows could not be cross-checked because their regional total is not on this crop. Doubtful / repaired cells (the page carries many stray ink specks and pen-like marks): - Virginia, column 10: printed as "2,530" preceded by a short stray dash/dot ("-2,530"). A negative count is impossible in this table; transcribed as 2,530. - East South Central, column 4: a stray dash precedes "29" ("- 29"); transcribed as 29. Confirmed by the member-State sum (4+12+3+10=29). - Mountain, column 9: a stray ")" -like mark precedes "2,173"; confirmed by sum. - Pacific, column 8: a stray ">" -like mark precedes "26,443"; confirmed by sum. - West South Central, column 12: a stray apostrophe precedes "4,380"; confirmed by sum. - Outlying areas, columns 2 and 3: stray marks precede "24" and "7" (printed as ", 24" and "/ 7"); confirmed by sum. - Utah, column 2: a stray colon-like mark precedes "9". - Oregon, column 8 and California, column 8: these two cells are partly broken up by an ink smear in the scan. Read as 2,522 and 19,233; both are confirmed by the Pacific total (4,688 + 2,522 + 19,233 = 26,443). - Florida, column 5: a small raised 4 precedes the value 2, recorded as 2^4. California, column 5: a small raised 5 precedes 63, recorded as 63^5. Both markers match footnotes 4 and 5. Footnote markers 2 and 3 are not present on this crop; they attach to rows on the earlier part of the table. The running head "Appendix A: Statistical Tables Covering the Fiscal Year 1948" is printed vertically along the right margin and has been omitted, as has the page number at the lower right.
Source image
Source data: U.S. NLRB Annual Reports (public domain). Reconstruction by NLRB Stats Archive. Read by claude-opus-5 (effort max, prompt extract_v1) from the 300-dpi scan; stitched by page. Updated October 2026.