NLRB Stats Archive › Annual Reports › FY1948 › Industrial distribution of collective bargaining elections, winner, eligible voters and valid votes cast
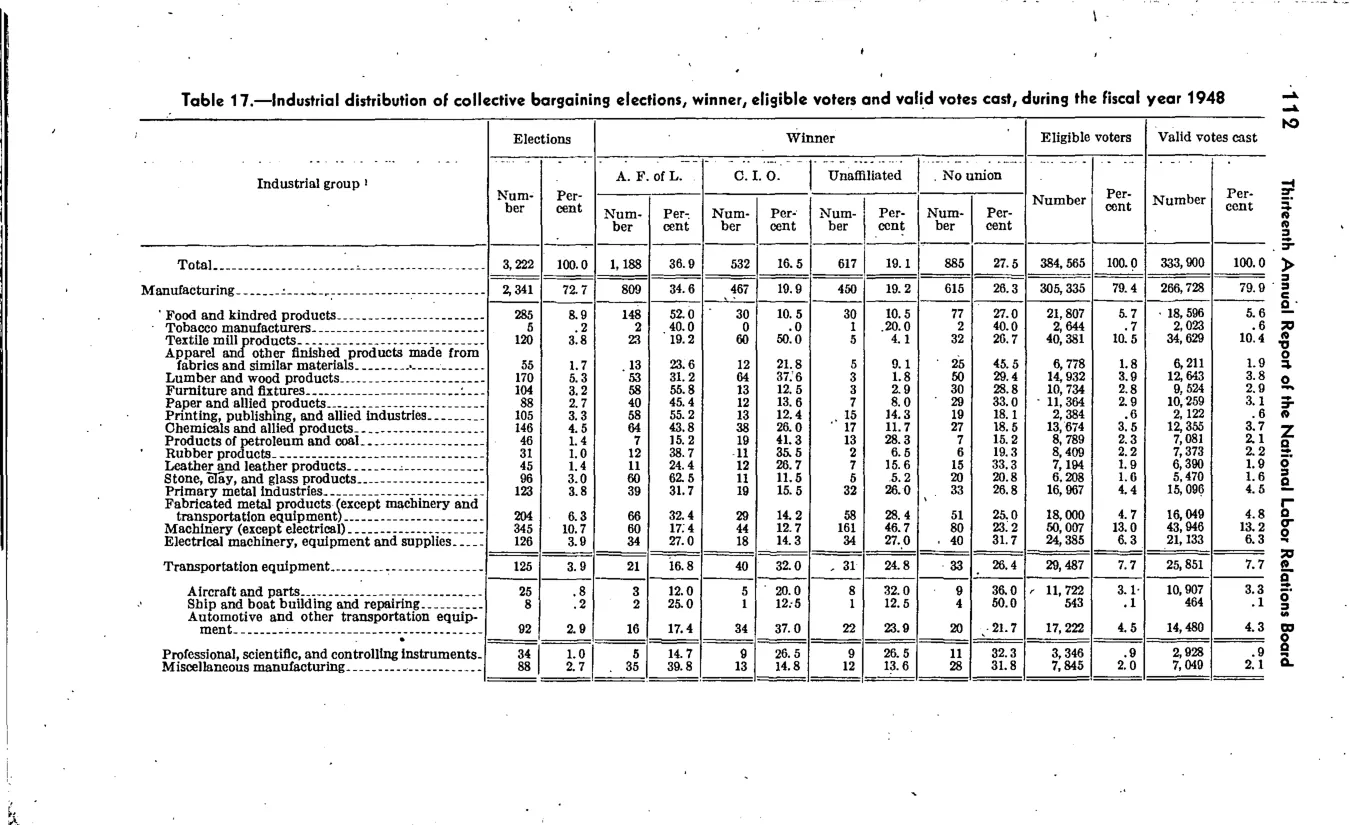
Industrial distribution of collective bargaining elections, winner, eligible voters and valid votes cast
| Industrial group | Elections | Elections | Winner — A.F. of L. | Winner — A.F. of L. | Winner — C.I.O. | Winner — C.I.O. | Winner — Unaffiliated | Winner — Unaffiliated | Winner — No union | Winner — No union | Eligible voters | Eligible voters | Valid votes cast | Valid votes cast |
|---|---|---|---|---|---|---|---|---|---|---|---|---|---|---|
| Number | Percent | Number | Percent | Number | Percent | Number | Percent | Number | Percent | Number | Percent | Number | Percent | |
| Total | 3,222 | 100 | 1,188 | 36.9 | 552 | 17.1 | 617 | 19.1 | 885 | 26.9 | 384,565 | 100 | 333,900 | 100 |
| Manufacturing | 2,341 | 72.7 | 809 | 34.6 | 467 | 19.9 | 430 | 18.4 | 615 | 26.3 | 305,235 | 79.4 | 266,728 | 79.9 |
| Manufacturing — Food and kindred products | 265 | 8.9 | 178 | 52 | 30 | 11 | 30 | 11.1 | 32 | 11.9 | 21,807 | 5.7 | 18,396 | 5.6 |
| Manufacturing — Textile-mill products | 129 | 4 | 6 | 4.7 | 56 | 43.4 | 14 | 10.9 | 53 | 41.1 | 40,381 | 10.5 | 34,829 | 10.4 |
| Manufacturing — Apparel and other finished products from fabrics and similar materials | 55 | 1.7 | 13 | 23.6 | 6 | 10.9 | 26 | 47.3 | 10 | 18.2 | 6,711 | 1.7 | 6,211 | 1.9 |
| Manufacturing — Primary metal industries | 123 | 3.8 | 31 | 25.2 | 79 | 64.2 | 5 | 4.1 | 8 | 6.5 | 26,107 | 6.8 | 23,159 | 6.9 |
| Manufacturing — Machinery (except electrical) | 345 | 10.7 | 60 | 17.4 | 117 | 33.9 | 14 | 4.1 | 154 | 44.6 | 24,358 | 6.4 | 21,193 | 6.3 |
| Manufacturing — Electrical machinery, equipment and supplies | 167 | 5.2 | 12 | 7.2 | 121 | 72.5 | 15 | 9 | 19 | 11.4 | 28,063 | 7.3 | 25,032 | 7.5 |
| Manufacturing — Transportation equipment | 125 | 3.9 | 21 | 16.8 | 41 | 32.8 | 32 | 25.6 | 31 | 24.8 | 25,317 | 6.6 | 23,851 | 7.1 |
Source image
Source data: U.S. NLRB Annual Reports (public domain). Reconstruction by NLRB Stats Archive. Updated June 2026.