NLRB Stats Archive › Annual Reports › FY1948 › Types of elections conducted during the fiscal year 1948
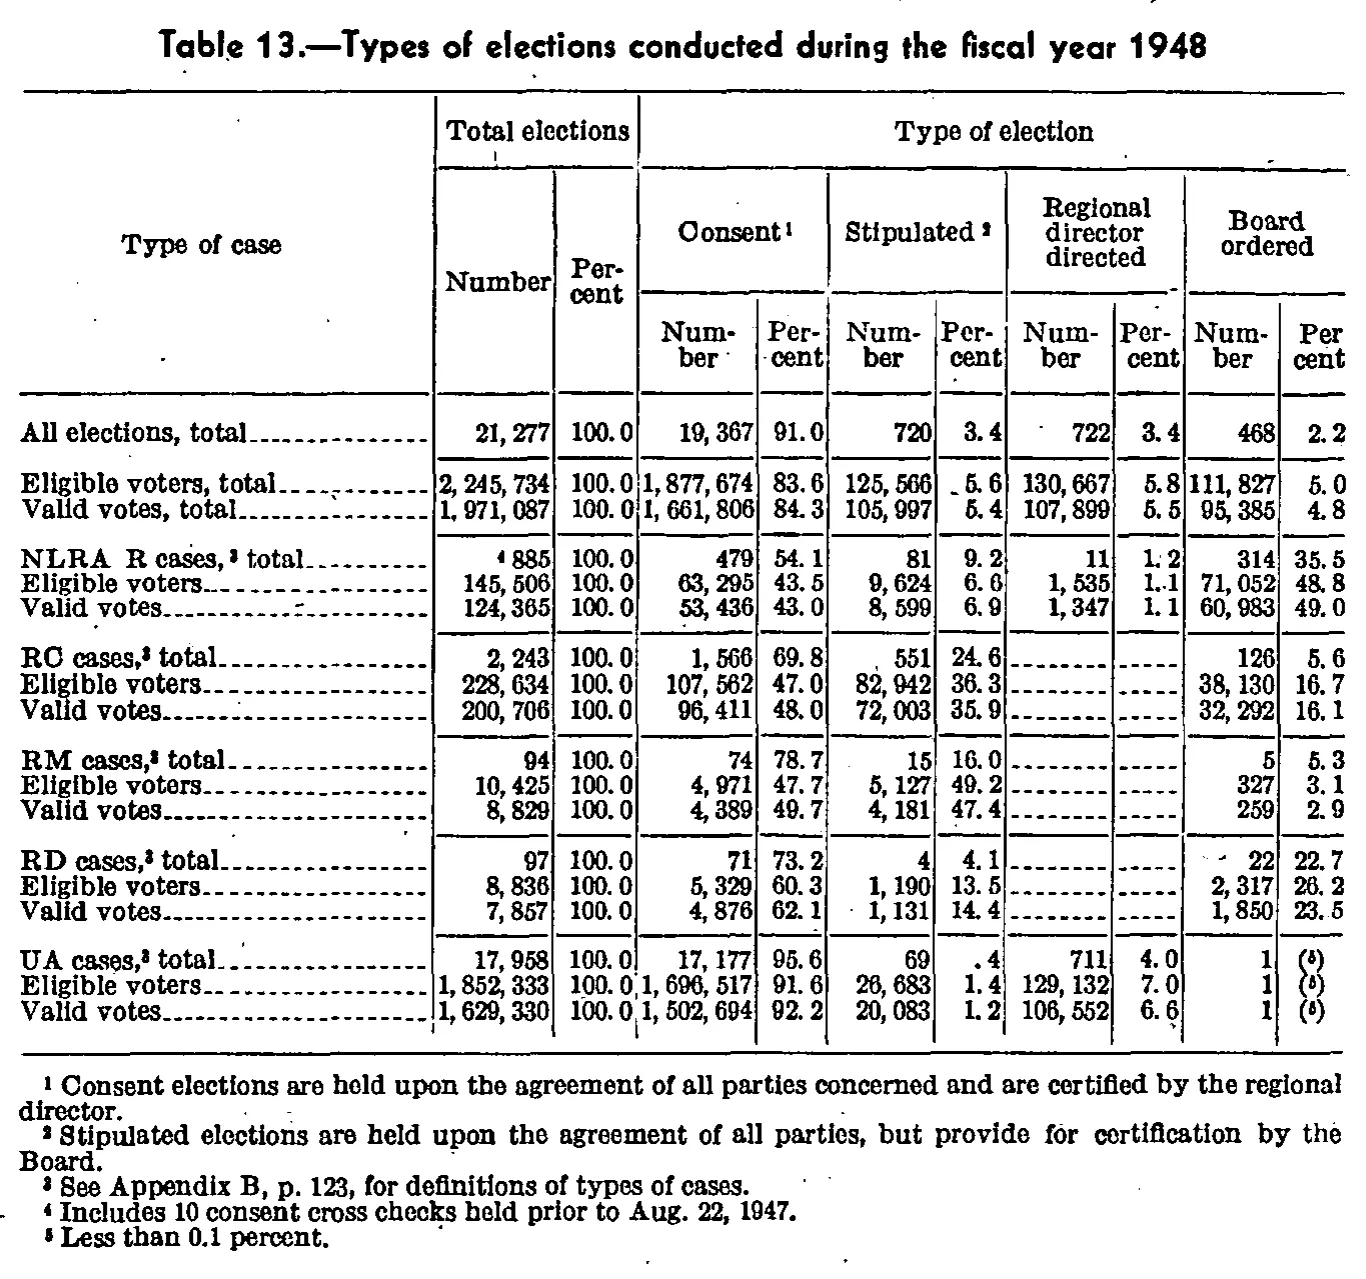
Types of elections conducted during the fiscal year 1948
| Type of case | Total elections | Type of election | ||||||||
|---|---|---|---|---|---|---|---|---|---|---|
| Type of case | Number | Percent | Consent | Stipulated | Regional director directed | Board ordered | ||||
| Type of case | Number | Percent | Number | Percent | Number | Percent | Number | Percent | Number | Percent |
| All elections, total | 21,277 | 100.0 | 19,367 | 91.0 | 720 | 3.4 | 722 | 3.4 | 468 | 2.2 |
| Eligible voters, total | 2,245,734 | 100.0 | 1,877,674 | 83.6 | 125,566 | 5.6 | 130,667 | 5.8 | 111,827 | 5.0 |
| Valid votes, total | 1,971,087 | 100.0 | 1,661,806 | 84.3 | 105,997 | 5.4 | 107,899 | 5.5 | 95,385 | 4.8 |
| NLRA R cases, total | 885 | 100.0 | 479 | 54.1 | 81 | 9.2 | 11 | 1.2 | 314 | 35.5 |
| Eligible voters | 145,506 | 100.0 | 63,295 | 43.5 | 9,624 | 6.6 | 1,535 | 1.1 | 71,052 | 48.8 |
| Valid votes | 124,365 | 100.0 | 53,436 | 43.0 | 8,599 | 6.9 | 1,347 | 1.1 | 60,983 | 49.0 |
| RC cases, total | 2,243 | 100.0 | 1,566 | 69.8 | 551 | 24.6 | 126 | 5.6 | ||
| Eligible voters | 228,634 | 100.0 | 107,562 | 47.0 | 82,942 | 36.3 | 38,130 | 16.7 | ||
| Valid votes | 200,706 | 100.0 | 96,411 | 48.0 | 72,003 | 35.9 | 32,292 | 16.1 | ||
| RM cases, total | 94 | 100.0 | 74 | 78.7 | 15 | 16.0 | 5 | 5.3 | ||
| Eligible voters | 10,425 | 100.0 | 4,971 | 47.7 | 5,127 | 49.2 | 327 | 3.1 | ||
| Valid votes | 8,829 | 100.0 | 4,389 | 49.7 | 4,181 | 47.4 | 259 | 2.9 | ||
| RD cases, total | 97 | 100.0 | 71 | 73.2 | 4 | 4.1 | 22 | 22.7 | ||
| Eligible voters | 8,836 | 100.0 | 5,329 | 60.3 | 1,190 | 13.5 | 2,317 | 26.2 | ||
| Valid votes | 7,857 | 100.0 | 4,876 | 62.1 | 1,131 | 14.4 | 1,850 | 23.5 | ||
| UA cases, total | 17,958 | 100.0 | 17,177 | 95.6 | 69 | .4 | 711 | 4.0 | 1 | |
| Eligible voters | 1,852,333 | 100.0 | 1,696,517 | 91.6 | 26,683 | 1.4 | 129,132 | 7.0 | 1 | |
| Valid votes | 1,629,330 | 100.0 | 1,502,694 | 92.2 | 20,083 | 1.2 | 106,552 | 6.6 | 1 | |
- 1 Consent elections are held upon the agreement of all parties concerned and are certified by the regional director.
- 2 Stipulated elections are held upon the agreement of all parties, but provide for certification by the Board.
- 3 See Appendix B, p. 123, for definitions of types of cases.
- 4 Includes 10 consent cross checks held prior to Aug. 22, 1947.
- 5 Less than 0.1 percent.
81 of 81 figures sit in a row or column sum that works out.
Reader’s notes
p. 117. Eleven columns: stub, Total elections (Number, Percent), then Number/Percent pairs under Consent, Stipulated, Regional director directed, and Board ordered. In the "NLRA R cases,^3 total" row the raised 4 is printed to the LEFT of 885 in the Total elections Number column; it is a footnote marker, transcribed as 885^4. The Regional director directed columns are a dash rule ("------") for all RC, RM and RD rows; those cells are left empty. The Board ordered Percent cell for the three UA rows is a parenthesized raised 5 (footnote: less than 0.1 percent), transcribed as (^5). Arithmetic checks: every row's four Number components sum exactly to the Total elections Number, and the five case-type blocks sum to the "All elections / Eligible voters / Valid votes" totals, so the digits are well corroborated. One printed percent looks slightly off: in the last row (UA cases, Valid votes), Regional director directed Percent is printed 6.6 while 106,552/1,629,330 = 6.5; transcribed as printed. Scan-quality note: the "Consent" heading renders with a degraded C that can look like an O in this JBIG2 scan; it is Consent. A few digits with the characteristic 6/0 ambiguity of this scan (NLRA R cases Eligible voters Stipulated Percent 6.6; RD cases Eligible voters Board ordered Percent 26.2) were confirmed against the row arithmetic.
Source image
Source data: U.S. NLRB Annual Reports (public domain). Reconstruction by NLRB Stats Archive. Read by claude-opus-5 (effort max, prompt extract_v1) from the 300-dpi scan; stitched by page. Updated October 2026.