NLRB Stats Archive › Annual Reports › FY1948 › Regional distribution of cases received during the fiscal year 1948
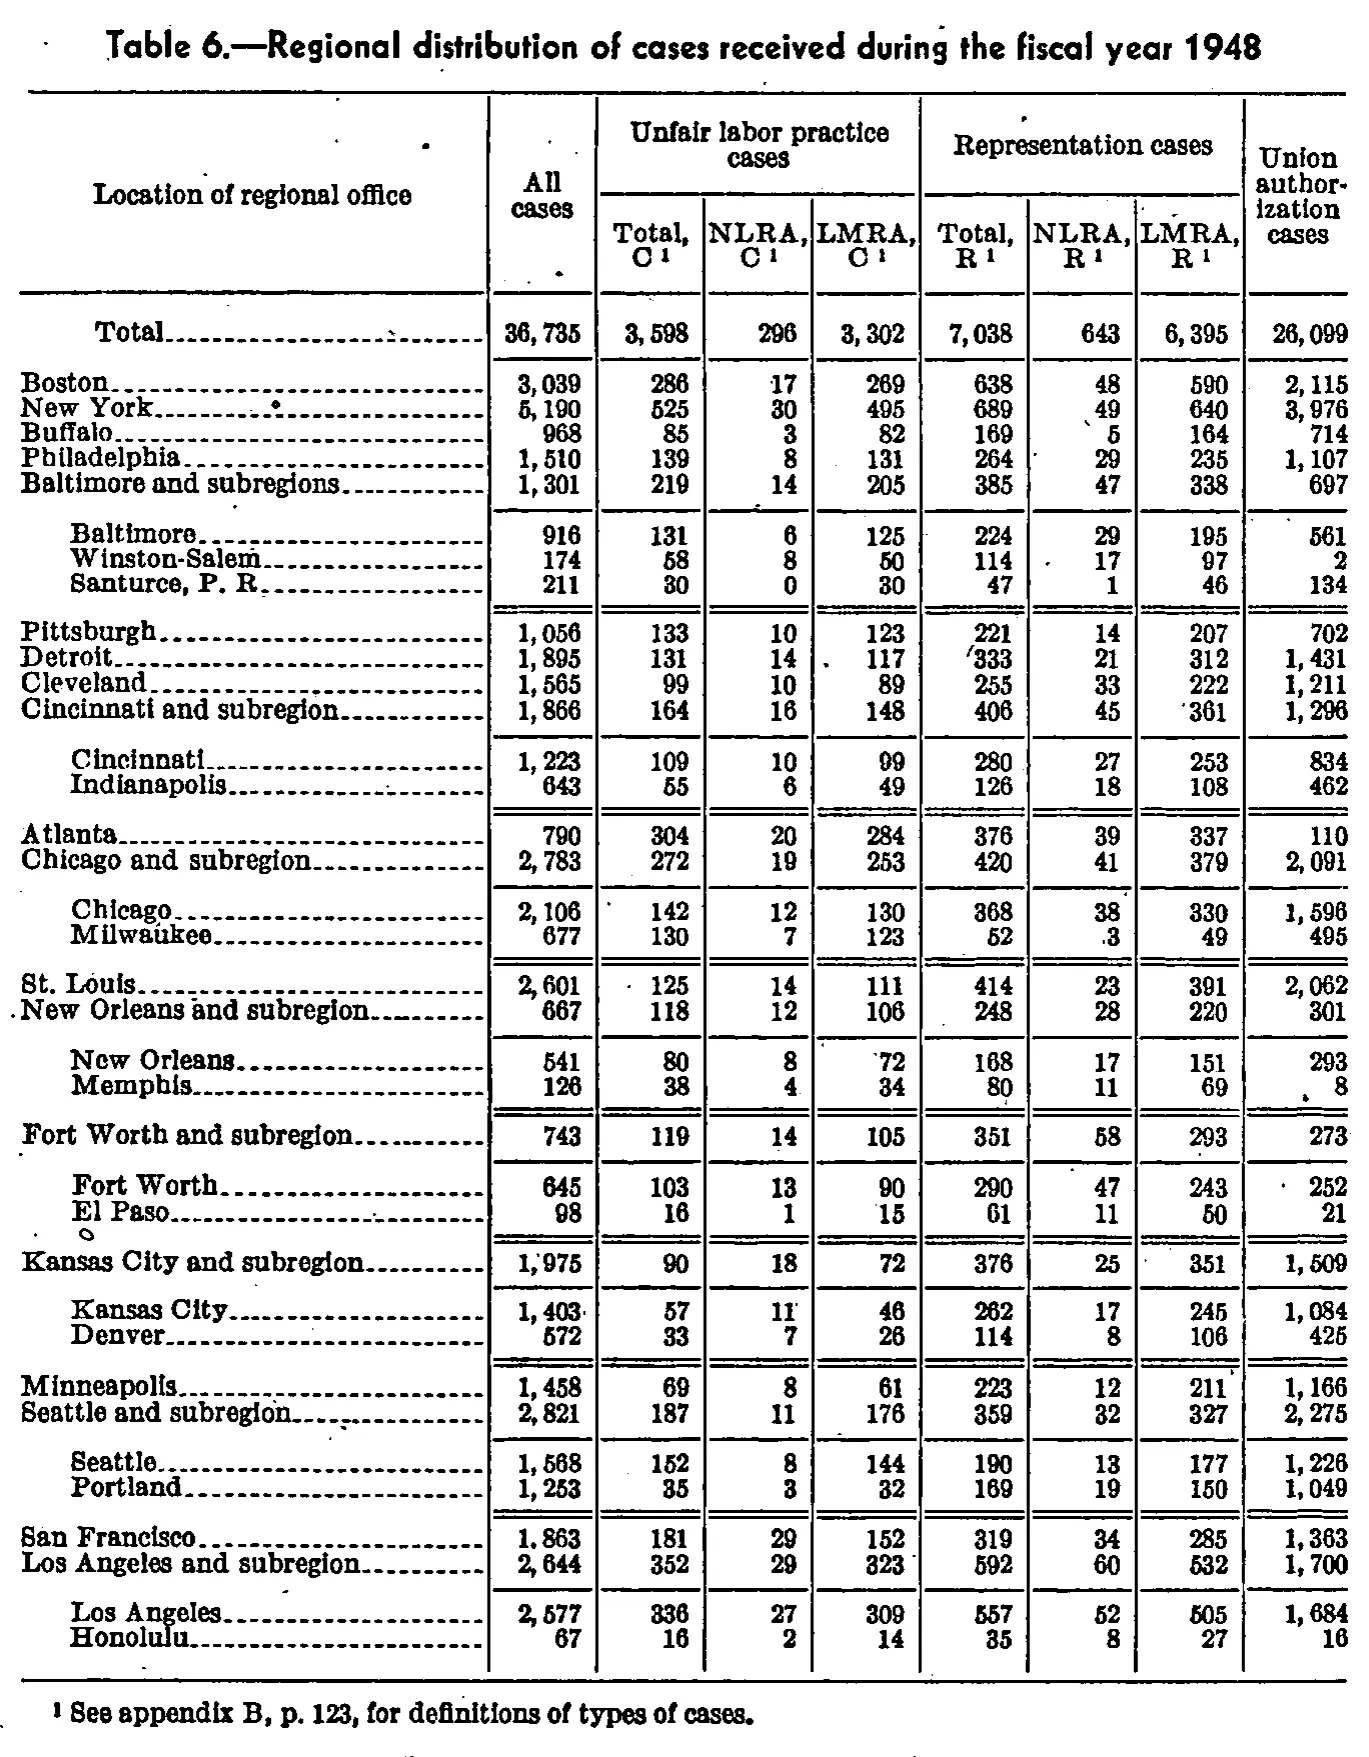
Regional distribution of cases received during the fiscal year 1948
| Location of regional office | All cases | Unfair labor practice cases | Representation cases | Union authorization cases | ||||
|---|---|---|---|---|---|---|---|---|
| Location of regional office | All cases | Total, C | NLRA, C | LMRA, C | Total, R | NLRA, R | LMRA, R | Union authorization cases |
| Total | 36,735 | 3,598 | 296 | 3,302 | 7,038 | 643 | 6,395 | 26,099 |
| Boston | 3,039 | 286 | 17 | 269 | 638 | 48 | 590 | 2,115 |
| New York | 5,190 | 525 | 30 | 495 | 689 | 49 | 640 | 3,976 |
| Buffalo | 968 | 85 | 3 | 82 | 169 | 5 | 164 | 714 |
| Philadelphia | 1,510 | 139 | 8 | 131 | 264 | 29 | 235 | 1,107 |
| Baltimore and subregions | 1,301 | 219 | 14 | 205 | 385 | 47 | 338 | 697 |
| Baltimore | 916 | 131 | 6 | 125 | 224 | 29 | 195 | 561 |
| Winston-Salem | 174 | 58 | 8 | 50 | 114 | 17 | 97 | 2 |
| Santurce, P. R. | 211 | 30 | 0 | 30 | 47 | 1 | 46 | 134 |
| Pittsburgh | 1,056 | 133 | 10 | 123 | 221 | 14 | 207 | 702 |
| Detroit | 1,895 | 131 | 14 | 117 | 333 | 21 | 312 | 1,431 |
| Cleveland | 1,565 | 99 | 10 | 89 | 255 | 33 | 222 | 1,211 |
| Cincinnati and subregion | 1,866 | 164 | 16 | 148 | 406 | 45 | 361 | 1,296 |
| Cincinnati | 1,223 | 109 | 10 | 99 | 280 | 27 | 253 | 834 |
| Indianapolis | 643 | 55 | 6 | 49 | 126 | 18 | 108 | 462 |
| Atlanta | 790 | 304 | 20 | 284 | 376 | 39 | 337 | 110 |
| Chicago and subregion | 2,783 | 272 | 19 | 253 | 420 | 41 | 379 | 2,091 |
| Chicago | 2,106 | 142 | 12 | 130 | 368 | 38 | 330 | 1,596 |
| Milwaukee | 677 | 130 | 7 | 123 | 52 | 3 | 49 | 495 |
| St. Louis | 2,601 | 125 | 14 | 111 | 414 | 23 | 391 | 2,062 |
| New Orleans and subregion | 667 | 118 | 12 | 106 | 248 | 28 | 220 | 301 |
| New Orleans | 541 | 80 | 8 | 72 | 168 | 17 | 151 | 293 |
| Memphis | 126 | 38 | 4 | 34 | 80 | 11 | 69 | 8 |
| Fort Worth and subregion | 743 | 119 | 14 | 105 | 351 | 58 | 293 | 273 |
| Fort Worth | 645 | 103 | 13 | 90 | 290 | 47 | 243 | 252 |
| El Paso | 98 | 16 | 1 | 15 | 61 | 11 | 50 | 21 |
| Kansas City and subregion | 1,975 | 90 | 18 | 72 | 376 | 25 | 351 | 1,509 |
| Kansas City | 1,403 | 57 | 11 | 46 | 262 | 17 | 245 | 1,084 |
| Denver | 572 | 33 | 7 | 26 | 114 | 8 | 106 | 425 |
| Minneapolis | 1,458 | 69 | 8 | 61 | 223 | 12 | 211 | 1,166 |
| Seattle and subregion | 2,821 | 187 | 11 | 176 | 359 | 32 | 327 | 2,275 |
| Seattle | 1,568 | 152 | 8 | 144 | 190 | 13 | 177 | 1,226 |
| Portland | 1,253 | 35 | 3 | 32 | 169 | 19 | 150 | 1,049 |
| San Francisco | 1,863 | 181 | 29 | 152 | 319 | 34 | 285 | 1,363 |
| Los Angeles and subregion | 2,644 | 352 | 29 | 323 | 592 | 60 | 532 | 1,700 |
| Los Angeles | 2,577 | 336 | 27 | 309 | 557 | 52 | 505 | 1,684 |
| Honolulu | 67 | 16 | 2 | 14 | 35 | 8 | 27 | 16 |
- 1 See appendix B, p. 123, for definitions of types of cases.
295 of 295 figures sit in a row or column sum that works out.
Reader’s notes
p. 111. Nine printed columns: stub, "All cases", three columns under "Unfair labor practice cases" (Total C, NLRA C, LMRA C), three under "Representation cases" (Total R, NLRA R, LMRA R), and "Union authorization cases" (a tall single heading spanning both heading levels, like the stub heading and "All cases"). The superscript 1 in the six case-type column headings is a footnote marker on the C/R case symbol; it is recorded as ^1 and is not part of the heading text. Rows for subregional offices (Baltimore, Winston-Salem, Santurce; Cincinnati, Indianapolis; Chicago, Milwaukee; New Orleans, Memphis; Fort Worth, El Paso; Kansas City, Denver; Seattle, Portland; Los Angeles, Honolulu) are printed indented beneath their "... and subregion(s)" parent row and set off by double rules; indentation is not represented in the grid, but row order is as printed. The scan is a coarse 1-bit halftone and several digits are degraded (e.g. the leading digit of "5,190" for New York, "572" for Denver, "1,568" for Seattle, and "52" for Milwaukee under Representation Total R). Every reading was cross-checked arithmetically: in all 37 rows All cases = Total C + Total R + Union authorization, Total C = NLRA C + LMRA C, Total R = NLRA R + LMRA R; each parent "... and subregion(s)" row equals the sum of its indented detail rows in all eight numeric columns; and the 19 regional-office rows sum to the printed Total row (36,735) in every column. No internal inconsistency or apparent misprint was found; nothing is cut off by the crop. "Santurce, P. R." is printed with spaced initials as shown. Atlanta's Union authorization figure (110) is far below neighbouring offices but is confirmed by the row's own total (304 + 376 + 110 = 790).
Source image
Source data: U.S. NLRB Annual Reports (public domain). Reconstruction by NLRB Stats Archive. Read by claude-opus-5 (effort max, prompt extract_v1) from the 300-dpi scan; stitched by page. Updated October 2026.