NLRB Stats Archive › Annual Reports › FY1948 › Geographic distribution of unfair labor practice and representation cases, by type of case, received during the fiscal year 1948
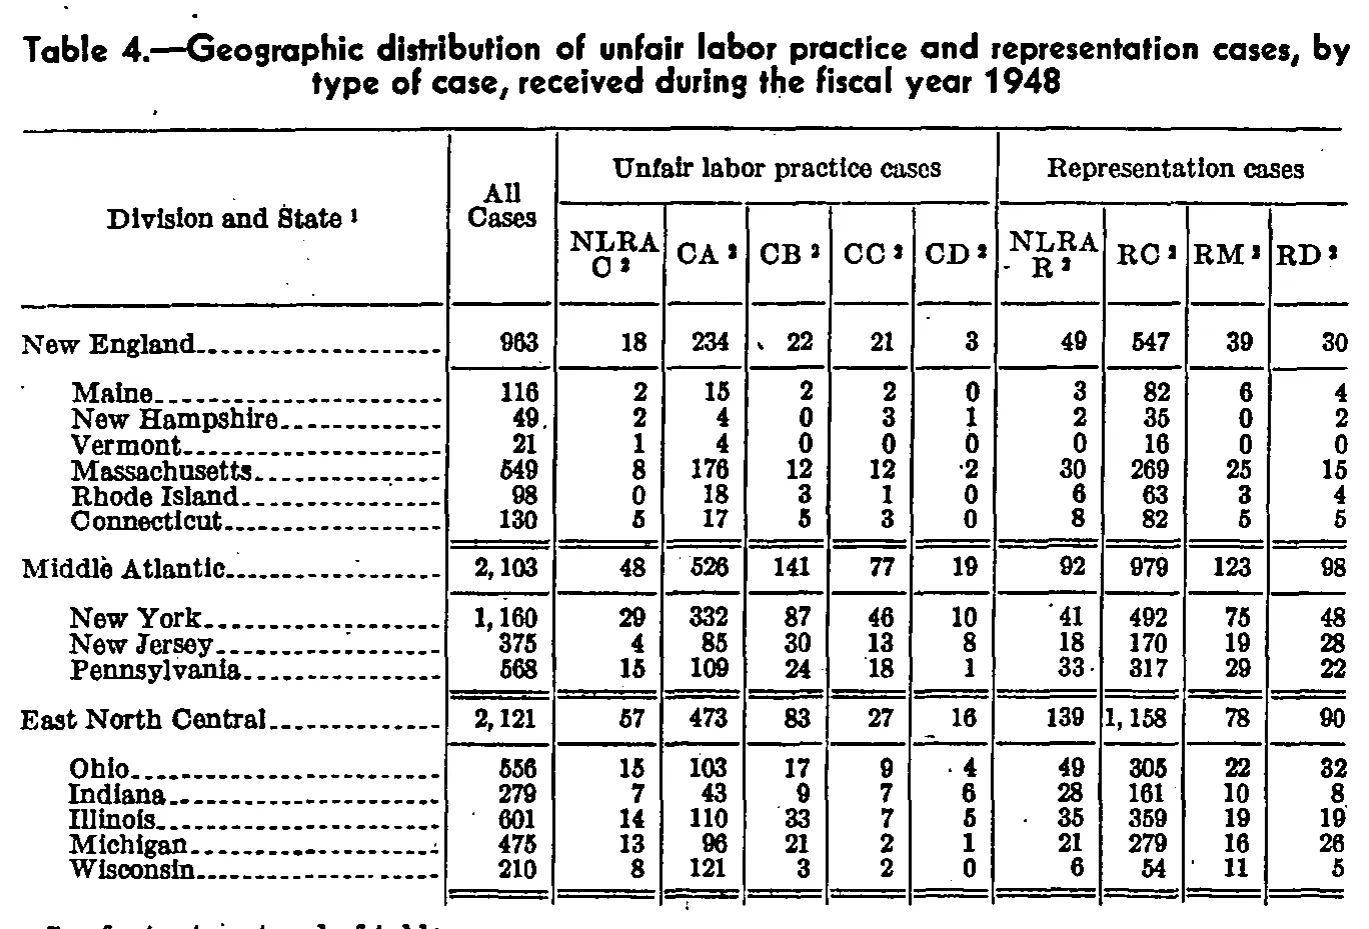
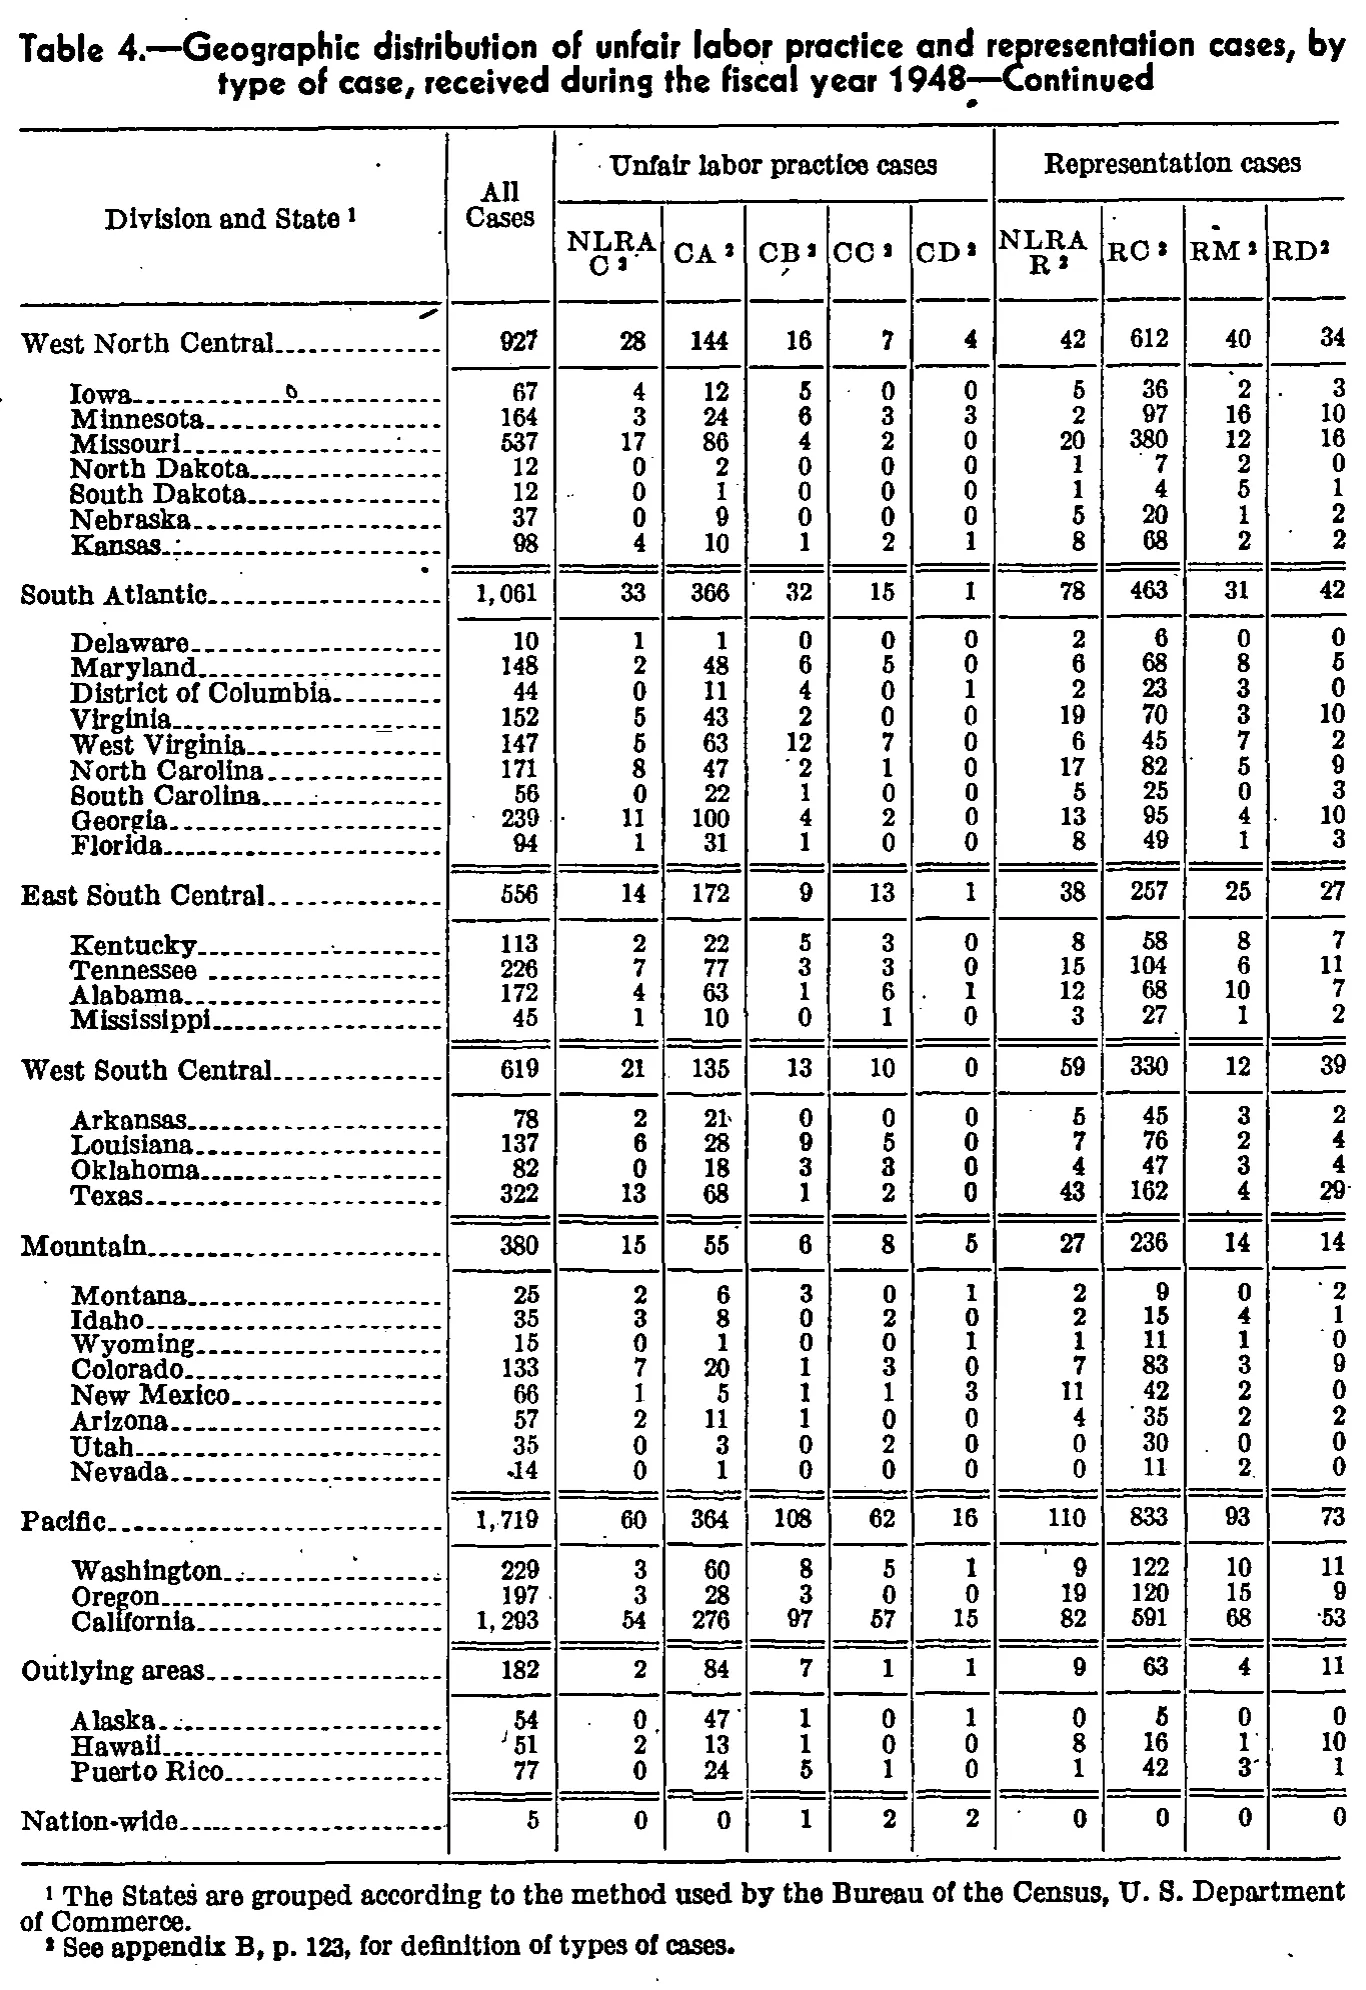
Geographic distribution of unfair labor practice and representation cases, by type of case, received during the fiscal year 1948
Stitched from pp. 108–109; a later page prints different headings, kept as rows.
| Division and State | All Cases | Unfair labor practice cases | Representation cases | |||||||
|---|---|---|---|---|---|---|---|---|---|---|
| Division and State | All Cases | NLRA C | CA | CB | CC | CD | NLRA R | RC | RM | RD |
| New England | 963 | 18 | 234 | 22 | 21 | 3 | 49 | 547 | 39 | 30 |
| Maine | 116 | 2 | 15 | 2 | 2 | 0 | 3 | 82 | 6 | 4 |
| New Hampshire | 49 | 2 | 4 | 0 | 3 | 1 | 2 | 35 | 0 | 2 |
| Vermont | 21 | 1 | 4 | 0 | 0 | 0 | 0 | 16 | 0 | 0 |
| Massachusetts | 549 | 8 | 176 | 12 | 12 | 2 | 30 | 269 | 25 | 15 |
| Rhode Island | 98 | 0 | 18 | 3 | 1 | 0 | 6 | 63 | 3 | 4 |
| Connecticut | 130 | 5 | 17 | 5 | 3 | 0 | 8 | 82 | 5 | 5 |
| Middle Atlantic | 2,103 | 48 | 526 | 141 | 77 | 19 | 92 | 979 | 123 | 98 |
| New York | 1,160 | 29 | 332 | 87 | 46 | 10 | 41 | 492 | 75 | 48 |
| New Jersey | 375 | 4 | 85 | 30 | 13 | 8 | 18 | 170 | 19 | 28 |
| Pennsylvania | 568 | 15 | 109 | 24 | 18 | 1 | 33 | 317 | 29 | 22 |
| East North Central | 2,121 | 57 | 473 | 83 | 27 | 16 | 139 | 1,158 | 78 | 90 |
| Ohio | 556 | 15 | 103 | 17 | 9 | 4 | 49 | 305 | 22 | 32 |
| Indiana | 279 | 7 | 43 | 9 | 7 | 6 | 28 | 161 | 10 | 8 |
| Illinois | 601 | 14 | 110 | 33 | 7 | 5 | 35 | 359 | 19 | 19 |
| Michigan | 475 | 13 | 96 | 21 | 2 | 1 | 21 | 279 | 16 | 26 |
| Wisconsin | 210 | 8 | 121 | 3 | 2 | 0 | 6 | 54 | 11 | 5 |
| Division and State | All Cases | Unfair labor practice cases | Unfair labor practice cases | Unfair labor practice cases | Unfair labor practice cases | Unfair labor practice cases | Representation cases | Representation cases | Representation cases | Representation cases |
| Division and State | All Cases | NLRA C | CA | CB | CC | CD | NLRA R | RC | RM | RD |
| West North Central | 927 | 28 | 144 | 16 | 7 | 4 | 42 | 612 | 40 | 34 |
| Iowa | 67 | 4 | 12 | 5 | 0 | 0 | 5 | 36 | 2 | 3 |
| Minnesota | 164 | 3 | 24 | 6 | 3 | 3 | 2 | 97 | 16 | 10 |
| Missouri | 537 | 17 | 86 | 4 | 2 | 0 | 20 | 380 | 12 | 16 |
| North Dakota | 12 | 0 | 2 | 0 | 0 | 0 | 1 | 7 | 2 | 0 |
| South Dakota | 12 | 0 | 1 | 0 | 0 | 0 | 1 | 4 | 5 | 1 |
| Nebraska | 37 | 0 | 9 | 0 | 0 | 0 | 5 | 20 | 1 | 2 |
| Kansas | 98 | 4 | 10 | 1 | 2 | 1 | 8 | 68 | 2 | 2 |
| South Atlantic | 1,061 | 33 | 366 | 32 | 15 | 1 | 78 | 463 | 31 | 42 |
| Delaware | 10 | 1 | 1 | 0 | 0 | 0 | 2 | 6 | 0 | 0 |
| Maryland | 148 | 2 | 48 | 6 | 5 | 0 | 6 | 68 | 8 | 5 |
| District of Columbia | 44 | 0 | 11 | 4 | 0 | 1 | 2 | 23 | 3 | 0 |
| Virginia | 152 | 5 | 43 | 2 | 0 | 0 | 19 | 70 | 3 | 10 |
| West Virginia | 147 | 5 | 63 | 12 | 7 | 0 | 6 | 45 | 7 | 2 |
| North Carolina | 171 | 8 | 47 | 2 | 1 | 0 | 17 | 82 | 5 | 9 |
| South Carolina | 56 | 0 | 22 | 1 | 0 | 0 | 5 | 25 | 0 | 3 |
| Georgia | 239 | 11 | 100 | 4 | 2 | 0 | 13 | 95 | 4 | 10 |
| Florida | 94 | 1 | 31 | 1 | 0 | 0 | 8 | 49 | 1 | 3 |
| East South Central | 556 | 14 | 172 | 9 | 13 | 1 | 38 | 257 | 25 | 27 |
| Kentucky | 113 | 2 | 22 | 5 | 3 | 0 | 8 | 58 | 8 | 7 |
| Tennessee | 226 | 7 | 77 | 3 | 3 | 0 | 15 | 104 | 6 | 11 |
| Alabama | 172 | 4 | 63 | 1 | 6 | 1 | 12 | 68 | 10 | 7 |
| Mississippi | 45 | 1 | 10 | 0 | 1 | 0 | 3 | 27 | 1 | 2 |
| West South Central | 619 | 21 | 135 | 13 | 10 | 0 | 59 | 330 | 12 | 39 |
| Arkansas | 78 | 2 | 21 | 0 | 0 | 0 | 5 | 45 | 3 | 2 |
| Louisiana | 137 | 6 | 28 | 9 | 5 | 0 | 7 | 76 | 2 | 4 |
| Oklahoma | 82 | 0 | 18 | 3 | 3 | 0 | 4 | 47 | 3 | 4 |
| Texas | 322 | 13 | 68 | 1 | 2 | 0 | 43 | 162 | 4 | 29 |
| Mountain | 380 | 15 | 55 | 6 | 8 | 5 | 27 | 236 | 14 | 14 |
| Montana | 25 | 2 | 6 | 3 | 0 | 1 | 2 | 9 | 0 | 2 |
| Idaho | 35 | 3 | 8 | 0 | 2 | 0 | 2 | 15 | 4 | 1 |
| Wyoming | 15 | 0 | 1 | 0 | 0 | 1 | 1 | 11 | 1 | 0 |
| Colorado | 133 | 7 | 20 | 1 | 3 | 0 | 7 | 83 | 3 | 9 |
| New Mexico | 66 | 1 | 5 | 1 | 1 | 3 | 11 | 42 | 2 | 0 |
| Arizona | 57 | 2 | 11 | 1 | 0 | 0 | 4 | 35 | 2 | 2 |
| Utah | 35 | 0 | 3 | 0 | 2 | 0 | 0 | 30 | 0 | 0 |
| Nevada | 14 | 0 | 1 | 0 | 0 | 0 | 0 | 11 | 2 | 0 |
| Pacific | 1,719 | 60 | 364 | 108 | 62 | 16 | 110 | 833 | 93 | 73 |
| Washington | 229 | 3 | 60 | 8 | 5 | 1 | 9 | 122 | 10 | 11 |
| Oregon | 197 | 3 | 28 | 3 | 0 | 0 | 19 | 120 | 15 | 9 |
| California | 1,293 | 54 | 276 | 97 | 57 | 15 | 82 | 591 | 68 | 53 |
| Outlying areas | 182 | 2 | 84 | 7 | 1 | 1 | 9 | 63 | 4 | 11 |
| Alaska | 54 | 0 | 47 | 1 | 0 | 1 | 0 | 5 | 0 | 0 |
| Hawaii | 51 | 2 | 13 | 1 | 0 | 0 | 8 | 16 | 1 | 10 |
| Puerto Rico | 77 | 0 | 24 | 5 | 1 | 0 | 1 | 42 | 3 | 1 |
| Nation-wide | 5 | 0 | 0 | 1 | 2 | 2 | 0 | 0 | 0 | 0 |
- 1 The States are grouped according to the method used by the Bureau of the Census, U. S. Department of Commerce.
- 2 See appendix B, p. 123, for definition of types of cases.
528 of 528 figures sit in a row or column sum that works out.
Reader’s notes
p. 108. The crop shows only the first three divisions (New England, Middle Atlantic, East North Central) and their states; the table continues below/on the following page. No numbered footnote texts are printed on this image — a partially cut-off line of small type at the very bottom edge appears to be a "See footnotes at end of table." reference rather than a footnote, so `footnotes` is empty. Footnote markers in the headings are small and broken by the scan. I read "Division and State^1", a marker 2 on the two "NLRA" columns (the pre-amendment C and R case types) and a marker 3 on the amended-Act codes CA, CB, CC, CD, RC, RM, RD; the raised 2 vs 3 glyphs are not fully legible and could all be the same digit. The letter in the heading "NLRA C" prints muddily and could be mistaken for "O"; I read it as C (the C-case counterpart of the "NLRA R" column). All figures were cross-checked: every state row sums across to its "All Cases" value, every division row equals the sum of its states both down each column and across to "All Cases". Wisconsin CA = 121 looks anomalously high relative to neighboring states (larger than Michigan's 96 despite far fewer total cases), but it is confirmed by both the column total (103+43+110+96+121 = 473) and the row total (210), so it is transcribed as printed.
p. 109. This is a continuation page: the caption carries "—Continued" and the table begins mid-list with the West North Central division, so the earlier divisions (New England, Middle Atlantic, East North Central) and the grand total are on the preceding page, not in this crop. Superscript markers in the case-type column headings (NLRA C, CA, CB, CC, CD, NLRA R, RC, RM, RD) are small and broken in the scan; several could be read as a raised 3 rather than 2. Since only footnotes 1 and 2 are printed and footnote 2 defines the types of cases, all nine are transcribed as ^2. Nevada, "All Cases": the figure is printed as 14 with a stray ink mark or broken rule immediately before the 1 (appears as ".14"); transcribed as 14, which is confirmed by the row's components summing to 14. Verification: every data row's nine component figures sum to its "All Cases" value, and every division subtotal equals the sum of its member States in all ten columns, so no digit substitutions are suspected.
Source image
Source data: U.S. NLRB Annual Reports (public domain). Reconstruction by NLRB Stats Archive. Read by claude-opus-5 (effort max, prompt extract_v1) from the 300-dpi scan; stitched by page. Updated October 2026.