NLRB Stats Archive › Annual Reports › FY1948 › Monthly distribution of cases received during the fiscal year 1948
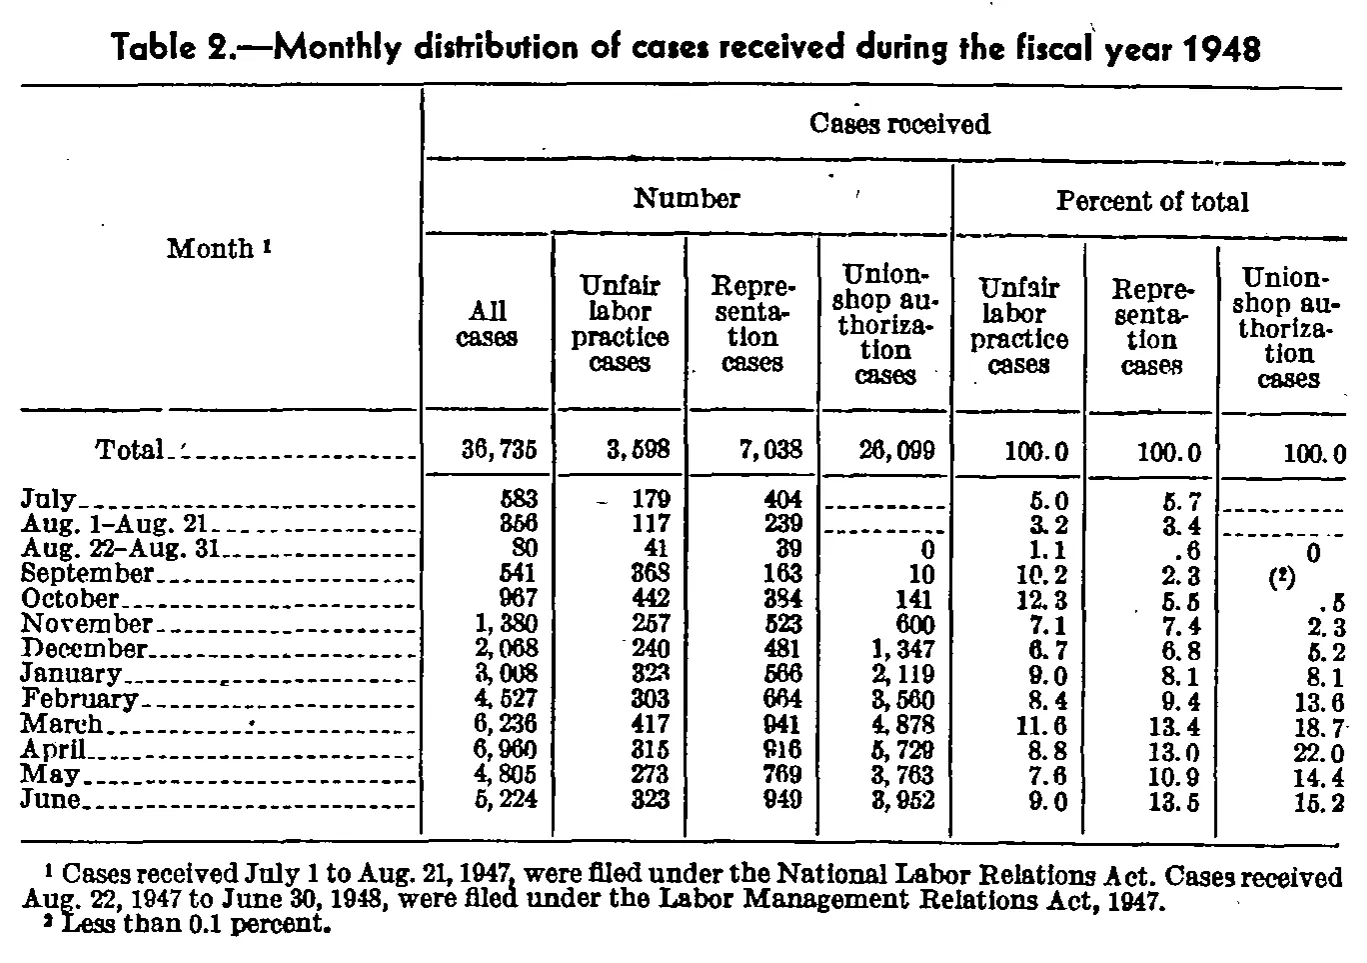
Monthly distribution of cases received during the fiscal year 1948
| Month | Cases received | ||||||
|---|---|---|---|---|---|---|---|
| Month | Number | Percent of total | |||||
| Month | All cases | Unfair labor practice cases | Representation cases | Union-shop authorization cases | Unfair labor practice cases | Representation cases | Union-shop authorization cases |
| Total | 36,735 | 3,598 | 7,038 | 26,099 | 100.0 | 100.0 | 100.0 |
| July | 583 | 179 | 404 | 5.0 | 5.7 | ||
| Aug. 1-Aug. 21 | 356 | 117 | 239 | 3.2 | 3.4 | ||
| Aug. 22-Aug. 31 | 80 | 41 | 39 | 0 | 1.1 | .6 | 0 |
| September | 541 | 368 | 163 | 10 | 10.2 | 2.3 | |
| October | 967 | 442 | 384 | 141 | 12.3 | 5.5 | .5 |
| November | 1,380 | 257 | 523 | 600 | 7.1 | 7.4 | 2.3 |
| December | 2,068 | 240 | 481 | 1,347 | 6.7 | 6.8 | 5.2 |
| January | 3,008 | 323 | 566 | 2,119 | 9.0 | 8.1 | 8.1 |
| February | 4,527 | 303 | 664 | 3,560 | 8.4 | 9.4 | 13.6 |
| March | 6,236 | 417 | 941 | 4,878 | 11.6 | 13.4 | 18.7 |
| April | 6,960 | 315 | 916 | 5,729 | 8.8 | 13.0 | 22.0 |
| May | 4,805 | 273 | 769 | 3,763 | 7.6 | 10.9 | 14.4 |
| June | 5,224 | 323 | 949 | 3,952 | 9.0 | 13.5 | 15.2 |
- 1 Cases received July 1 to Aug. 21, 1947, were filed under the National Labor Relations Act. Cases received Aug. 22, 1947 to June 30, 1948, were filed under the Labor Management Relations Act, 1947.
- 2 Less than 0.1 percent.
53 of 53 figures sit in a row or column sum that works out.
Reader’s notes
p. 106. Grid is 8 columns: stub plus four "Number" columns (All cases, Unfair labor practice, Representation, Union-shop authorization) and three "Percent of total" columns (no percent column is printed for "All cases"). Scan quality: this is a coarse 300-ppi bitonal scan in which 3/8/9 are easily confused. I resolved the doubtful digits by cross-footing, and every row and every column balances exactly against the printed totals, so I believe the readings are right. Specifically: Aug. 1-Aug. 21 "All cases" reads 356 (117+239=356, and the column sums to 3,598/7,038); September "Unfair labor practice cases" reads 368 (368+163+10=541); October "Representation cases" reads 384 (442+384+141=967; 384/7,038=5.5% as printed); June "Union-shop authorization cases" reads 3,952 (323+949+3,952=5,224). All four row sums, and all four column sums against the Total line, agree exactly as transcribed. Union-shop authorization columns: the July and Aug. 1-Aug. 21 cells carry dash rules rather than figures (no union-shop cases existed before the Labor Management Relations Act took effect Aug. 22, 1947), so they are transcribed as "". The Aug. 22-Aug. 31 cells hold a printed zero, transcribed as 0. September, "Union-shop authorization cases" under "Percent of total": the cell holds a standalone parenthesized raised 2 — a footnote reference pointing to "Less than 0.1 percent", not a value. I wrote it as (^2) to keep both the printed parentheses and the raised-marker signal. Two printed percentages differ by one unit in the last place from the ratio of the printed counts: January Representation shows 8.1 (566/7,038 = 8.04) and June Union-shop authorization shows 15.2 (3,952/26,099 = 15.14). Both are transcribed exactly as printed. A short stray dash appears just left of "179" in the July "Unfair labor practice cases" cell; it is a scan artifact or leader fragment, not part of the figure, so it is not transcribed. A stray colon-like mark follows the "March" leader dots and is likewise omitted. Leader dots after row labels are dropped throughout.
Source image
Source data: U.S. NLRB Annual Reports (public domain). Reconstruction by NLRB Stats Archive. Read by claude-opus-5 (effort max, prompt extract_v1) from the 300-dpi scan; stitched by page. Updated October 2026.