NLRB Stats Archive › Annual Reports › FY1947 › Elections and cross checks won and lost during the fiscal years 1936-47
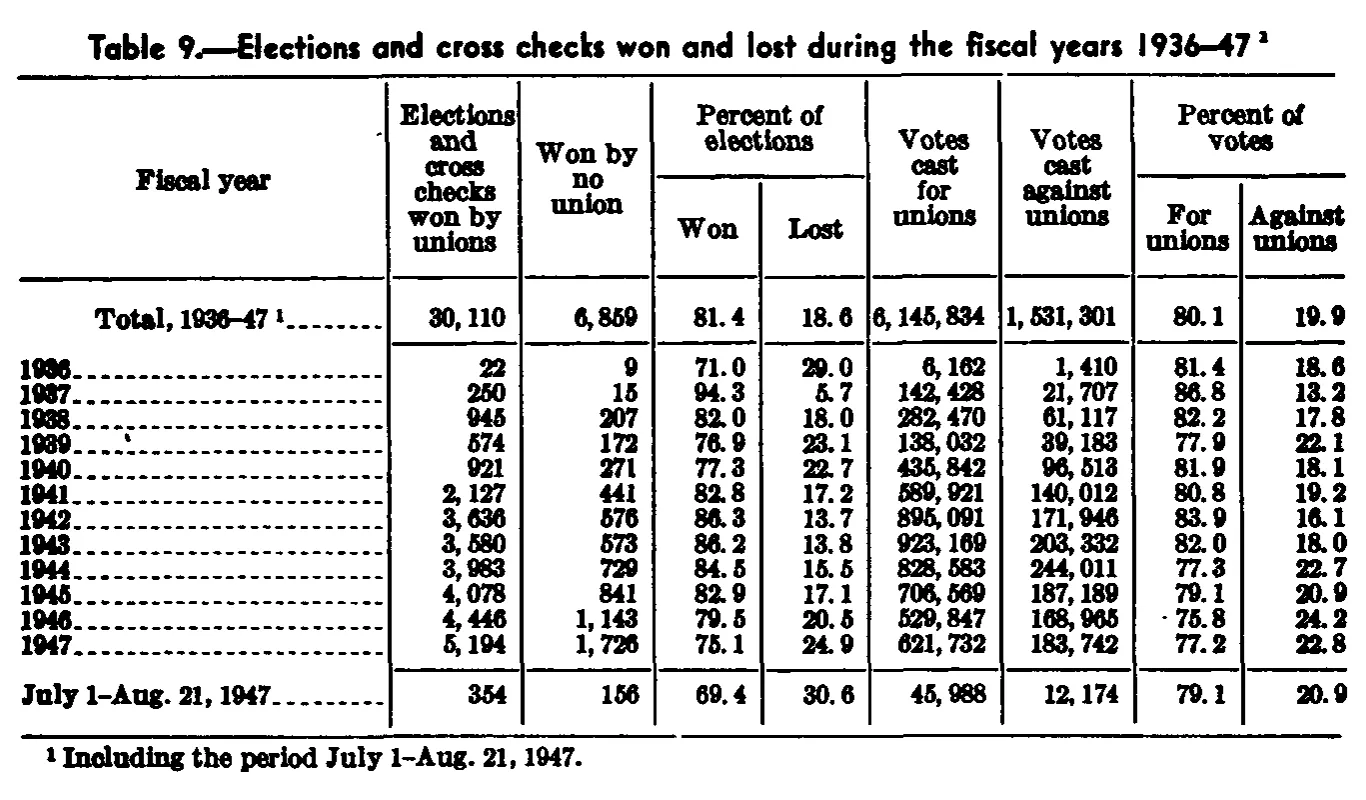
Elections and cross checks won and lost during the fiscal years 1936-47
| Fiscal year | Elections and cross checks won by unions | Won by no union | Percent of elections | Votes cast for unions | Votes cast against unions | Percent of votes | ||
|---|---|---|---|---|---|---|---|---|
| Fiscal year | Elections and cross checks won by unions | Won by no union | Won | Lost | Votes cast for unions | Votes cast against unions | For unions | Against unions |
| Total, 1936–47 | 30,110 | 6,859 | 81.4 | 18.6 | 6,145,834 | 1,531,301 | 80.1 | 19.9 |
| 1936 | 22 | 9 | 71.0 | 29.0 | 6,162 | 1,410 | 81.4 | 18.6 |
| 1937 | 250 | 15 | 94.3 | 5.7 | 142,428 | 21,707 | 86.8 | 13.2 |
| 1938 | 945 | 207 | 82.0 | 18.0 | 282,470 | 61,117 | 82.2 | 17.8 |
| 1939 | 574 | 172 | 76.9 | 23.1 | 138,032 | 39,183 | 77.9 | 22.1 |
| 1940 | 921 | 271 | 77.3 | 22.7 | 435,842 | 96,513 | 81.9 | 18.1 |
| 1941 | 2,127 | 441 | 82.8 | 17.2 | 589,921 | 140,012 | 80.8 | 19.2 |
| 1942 | 3,636 | 576 | 86.3 | 13.7 | 895,091 | 171,946 | 83.9 | 16.1 |
| 1943 | 3,580 | 573 | 86.2 | 13.8 | 923,169 | 203,332 | 82.0 | 18.0 |
| 1944 | 3,963 | 729 | 84.5 | 15.5 | 828,583 | 244,011 | 77.3 | 22.7 |
| 1945 | 4,078 | 841 | 82.9 | 17.1 | 706,569 | 187,189 | 79.1 | 20.9 |
| 1946 | 4,446 | 1,143 | 79.5 | 20.5 | 529,847 | 168,965 | 75.8 | 24.2 |
| 1947 | 5,194 | 1,726 | 75.1 | 24.9 | 621,732 | 183,742 | 77.2 | 22.8 |
| July 1–Aug. 21, 1947 | 354 | 156 | 69.4 | 30.6 | 45,988 | 12,174 | 79.1 | 20.9 |
- 1 Including the period July 1-Aug. 21, 1947.
0 of 56 figures sit in a row or column sum that works out.
Reader’s notes
p. 97. Nine columns: stub plus two count columns, a two-part "Percent of elections" spanner (Won, Lost), two vote-count columns, and a two-part "Percent of votes" spanner (For unions, Against unions). Column 1 heading is set on six short lines ("Elections / and / cross / checks / won by / unions") and is joined here into one line; likewise columns 2, 5 and 6. Arithmetic check on the printed figures: the twelve fiscal-year rows plus the July 1-Aug. 21, 1947 row sum exactly to the printed totals in "Won by no union" (6,859), "Votes cast for unions" (6,145,834) and "Votes cast against unions" (1,531,301), which corroborates the digits read in those columns. The same addition in column 1 ("Elections and cross checks won by unions") gives 30,090, which is 20 less than the printed total of 30,110. The individual-year figures in that column are each consistent with their own printed "Percent of elections Won" value, so the shortfall appears to be a misprint in the source rather than a misread cell; everything is transcribed as printed and nothing has been adjusted. Minor image issues: in the 1946 row a stray ink mark/leader-dot artifact sits immediately left of the "For unions" value 75.8; it is not a footnote marker or a digit and is omitted. The 1939 row has a similar small artifact in the stub area after the year. The scan is a coarse bitonal one in which the digit 3 in several stub years (1936, 1937, 1938) and in some figures prints with a filled upper bowl that can resemble an 8 or 9; the readings given follow the column arithmetic checks above and the 1936-47 span stated in the caption and footnote. The dashes in "Total, 1936–47" and "July 1–Aug. 21, 1947" are printed as en dashes.
Source image
Source data: U.S. NLRB Annual Reports (public domain). Reconstruction by NLRB Stats Archive. Read by claude-opus-5 (effort max, prompt extract_v1) from the 300-dpi scan; stitched by page. Updated October 2026.