NLRB Stats Archive › Annual Reports › FY1947 › Eligible voters, valid votes cast, and percent of eligibles casting valid votes
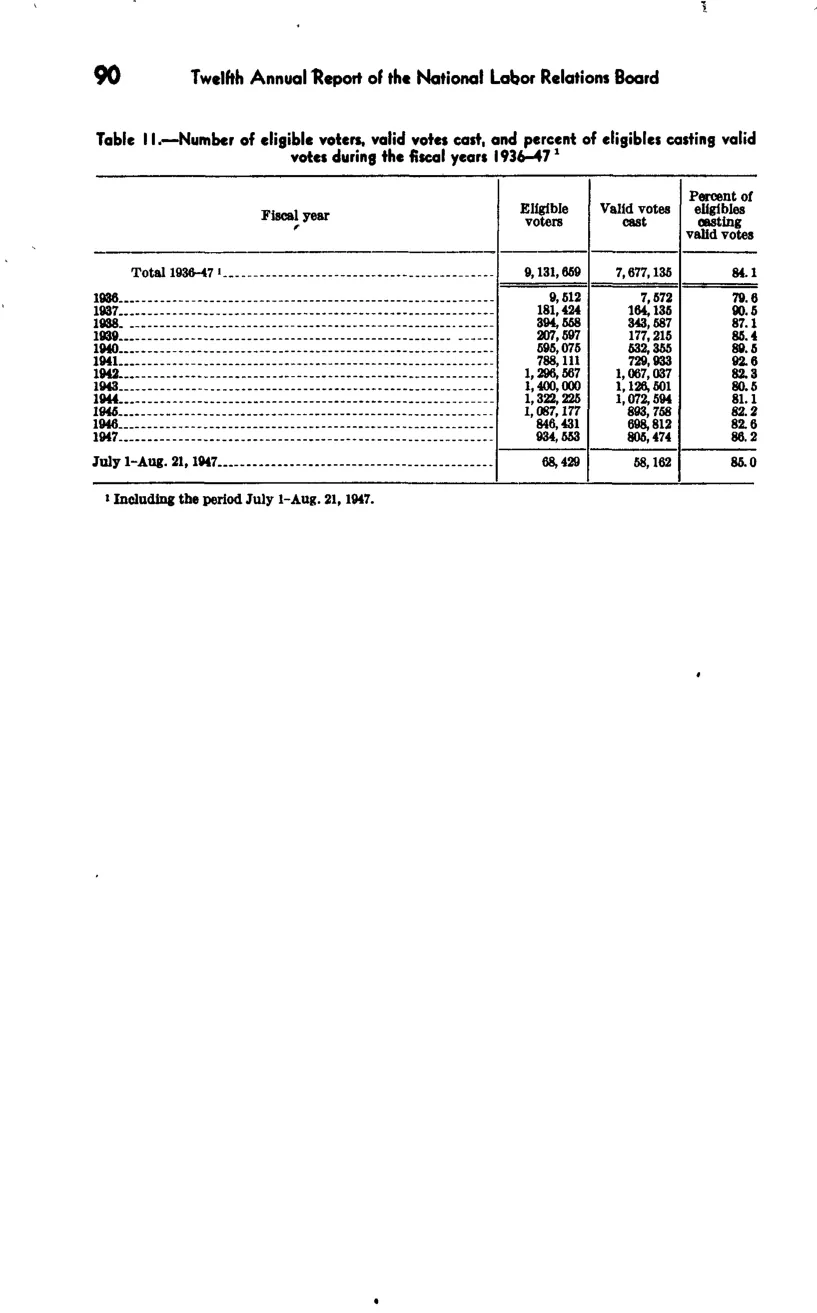
Eligible voters, valid votes cast, and percent of eligibles casting valid votes
| Eligible voters | Valid votes cast | Percent of eligibles casting valid votes | |
|---|---|---|---|
| Total 1936-47 | 9,131,659 | 7,677,135 | 84.1 |
| 1936 | 9,612 | 7,572 | 79.6 |
| 1937 | 181,424 | 164,135 | 90.5 |
| 1938 | 394,558 | 343,587 | 87.1 |
| 1939 | 207,597 | 177,215 | 85.4 |
| 1940 | 595,075 | 532,335 | 89.5 |
| 1941 | 798,111 | 793,933 | 92.6 |
| 1942 | 1,296,567 | 1,067,037 | 82.3 |
| 1943 | 1,400,000 | 1,126,501 | 80.5 |
| 1944 | 1,322,225 | 1,072,594 | 81.1 |
| 1945 | 1,067,277 | 893,726 | 82.2 |
| 1946 | 846,431 | 696,812 | 82.6 |
| 1947 | 934,453 | 805,474 | 86.2 |
| July 1-Aug. 21, 1947 | 68,429 | 58,162 | 85 |
Source image
Source data: U.S. NLRB Annual Reports (public domain). Reconstruction by NLRB Stats Archive. Updated June 2026.