NLRB Stats Archive › Annual Reports › FY1947 › Disposition of representation cases closed
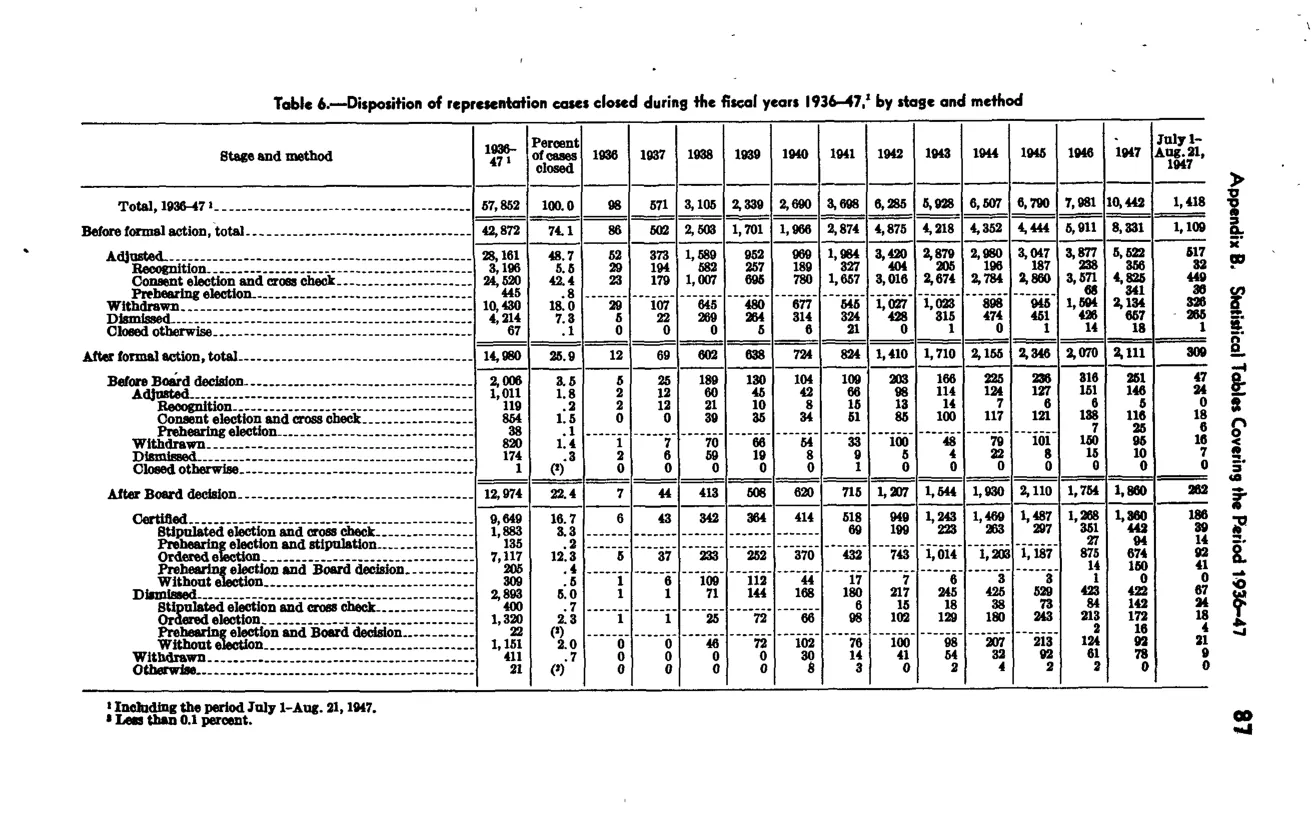
Disposition of representation cases closed
| 1936-47 | Percent of cases closed | 1936 | 1937 | 1938 | 1939 | 1940 | 1941 | 1942 | 1943 | 1944 | 1945 | 1946 | 1947 | July 1-Aug. 21, 1947 | |
|---|---|---|---|---|---|---|---|---|---|---|---|---|---|---|---|
| Total, 1936-47 | 57,852 | 100 | 98 | 571 | 3,105 | 2,339 | 3,038 | 2,098 | 6,265 | 2,289 | 5,328 | 5,237 | 7,981 | 10,442 | 1,418 |
| Before formal action, total | 42,872 | 74.1 | 86 | 502 | 2,503 | 1,701 | 1,966 | 1,371 | 4,444 | 1,711 | 4,352 | 4,444 | 5,911 | 8,331 | 1,109 |
| After formal action, total | 14,980 | 25.9 | 12 | 69 | 602 | 638 | 734 | 924 | 1,621 | 578 | 2,156 | 2,365 | 2,070 | 918 | 309 |
| Before Board decision | 2,008 | 3.5 | |||||||||||||
| After Board decision | 12,974 | 22.4 |
Source image
Source data: U.S. NLRB Annual Reports (public domain). Reconstruction by NLRB Stats Archive. Updated June 2026.