NLRB Stats Archive › Annual Reports › FY1947 › Cases filed during the fiscal years 1936-47
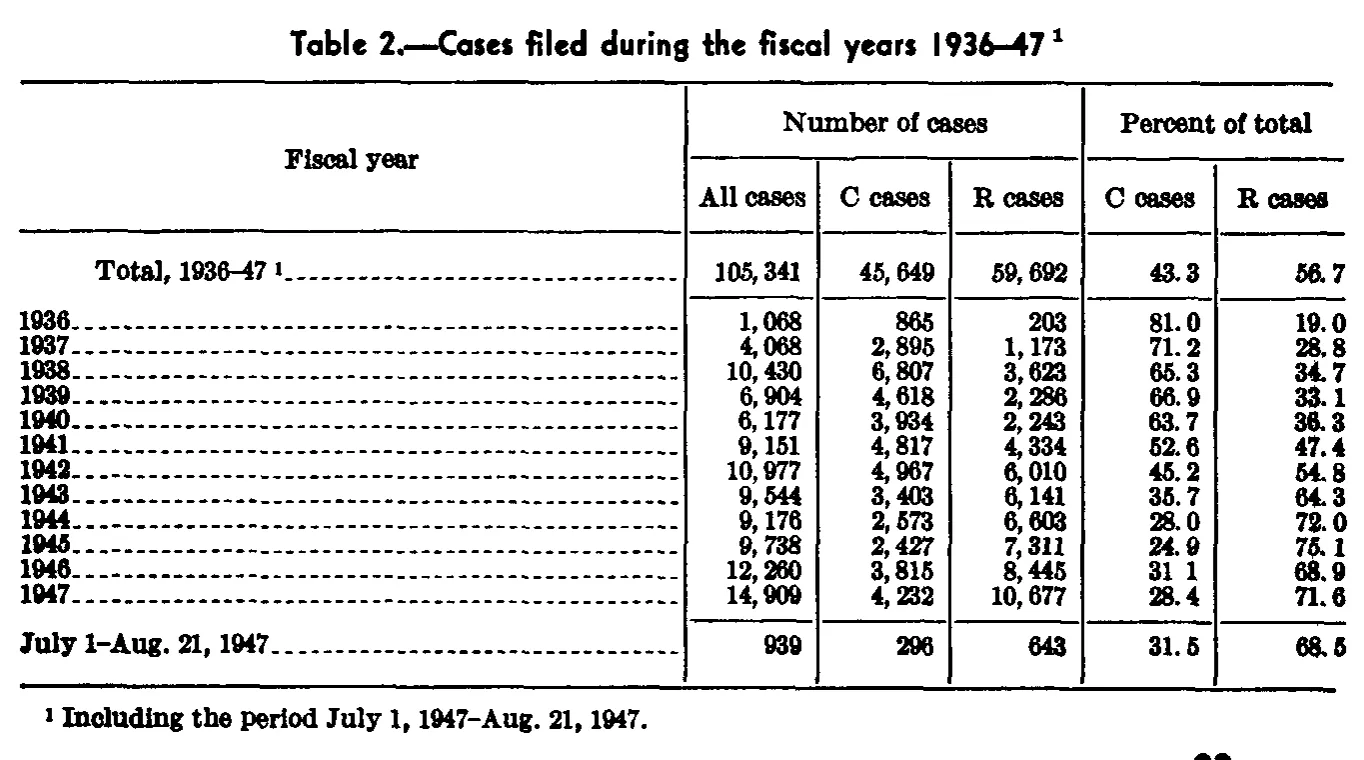
Cases filed during the fiscal years 1936-47
| Fiscal year | Number of cases | Percent of total | |||
|---|---|---|---|---|---|
| Fiscal year | All cases | C cases | R cases | C cases | R cases |
| Total, 1936-47 | 105,341 | 45,649 | 59,692 | 43.3 | 56.7 |
| 1936 | 1,068 | 865 | 203 | 81.0 | 19.0 |
| 1937 | 4,068 | 2,895 | 1,173 | 71.2 | 28.8 |
| 1938 | 10,430 | 6,807 | 3,623 | 65.3 | 34.7 |
| 1939 | 6,904 | 4,618 | 2,286 | 66.9 | 33.1 |
| 1940 | 6,177 | 3,934 | 2,243 | 63.7 | 36.3 |
| 1941 | 9,151 | 4,817 | 4,334 | 52.6 | 47.4 |
| 1942 | 10,977 | 4,967 | 6,010 | 45.2 | 54.8 |
| 1943 | 9,544 | 3,403 | 6,141 | 35.7 | 64.3 |
| 1944 | 9,176 | 2,573 | 6,603 | 28.0 | 72.0 |
| 1945 | 9,738 | 2,427 | 7,311 | 24.9 | 75.1 |
| 1946 | 12,260 | 3,815 | 8,445 | 31.1 | 68.9 |
| 1947 | 14,909 | 4,232 | 10,677 | 28.4 | 71.6 |
| July 1-Aug. 21, 1947 | 939 | 296 | 643 | 31.5 | 68.5 |
- 1 Including the period July 1, 1947-Aug. 21, 1947.
42 of 42 figures sit in a row or column sum that works out.
Reader’s notes
p. 91. Six columns: stub plus three under "Number of cases" and two under "Percent of total". Doubtful cell: row 1946, column "C cases" under "Percent of total" is printed as "31 1" — the decimal point did not survive the scan (every other percent in the column has one, and the paired R-cases value 68.9 implies 31.1); transcribed as "31.1". The row labels 1936-1947 are bare years followed by leader dots; the dash in "Total, 1936-47" and "July 1-Aug. 21, 1947" is an en dash in the original. The caption's own footnote marker (Table 2 ... 1936-47 1) is omitted per instructions, but the same footnote 1 is also attached to the "Total, 1936-47" row label and is kept there. Arithmetic spot-checks of the detail years against "All cases" agree as printed.
Source image
Source data: U.S. NLRB Annual Reports (public domain). Reconstruction by NLRB Stats Archive. Read by claude-opus-5 (effort max, prompt extract_v1) from the 300-dpi scan; stitched by page. Updated October 2026.