NLRB Stats Archive › Annual Reports › FY1947 › Regional distribution of cases received during the fiscal year 1947, compared with 1946
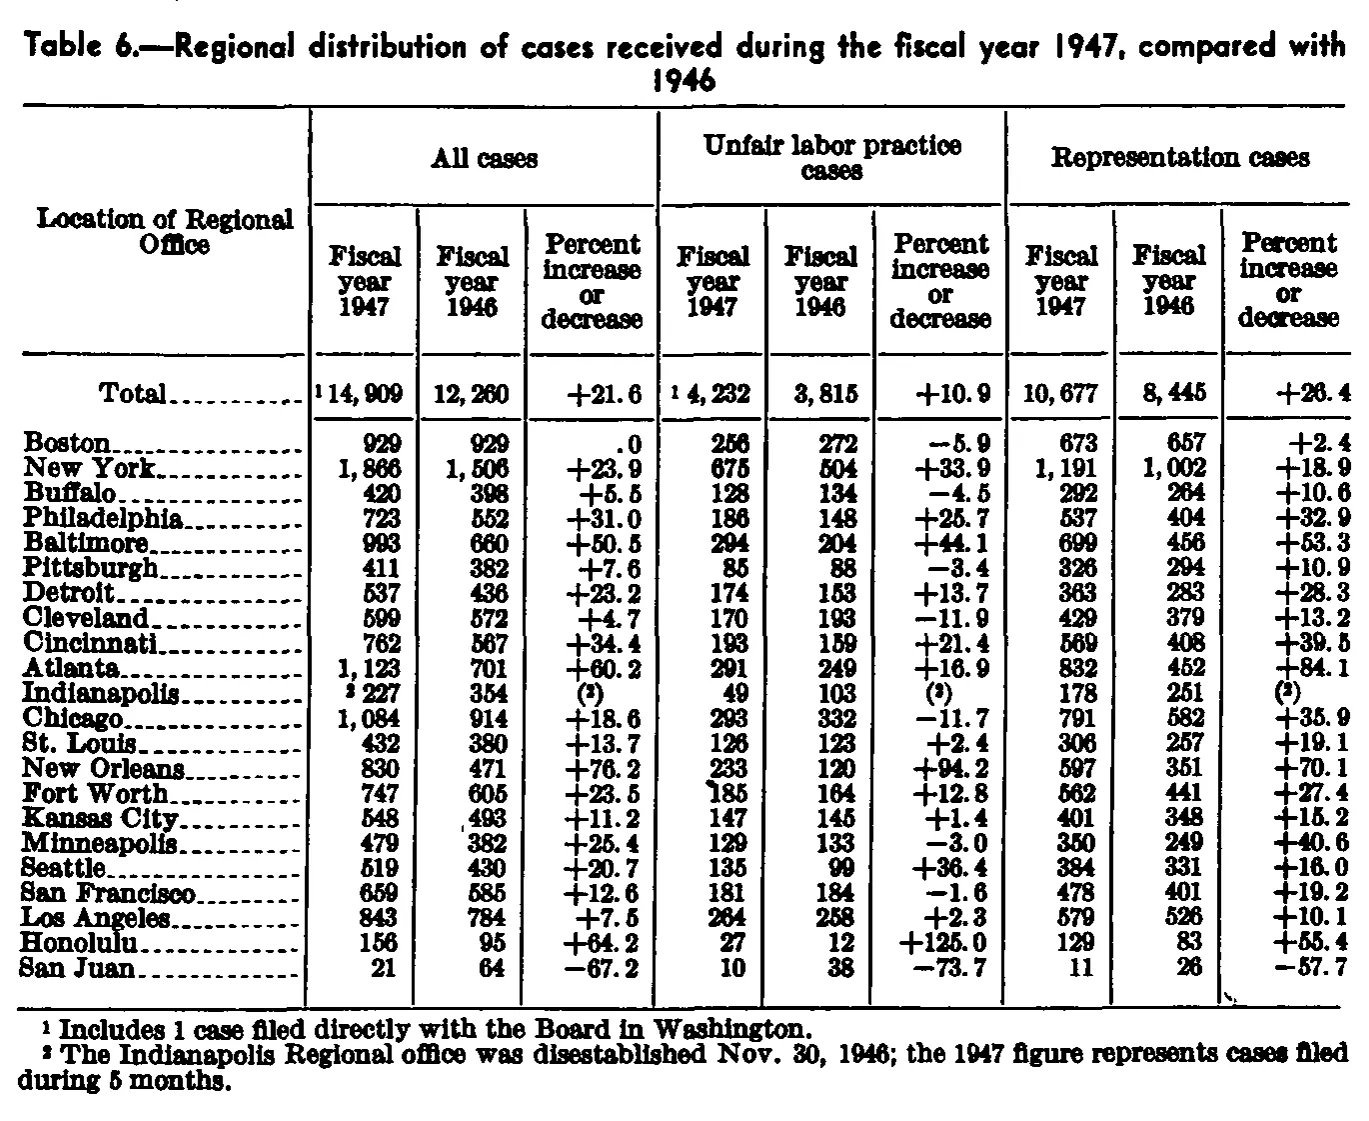
Regional distribution of cases received during the fiscal year 1947, compared with 1946
| Location of Regional Office | All cases | Unfair labor practice cases | Representation cases | ||||||
|---|---|---|---|---|---|---|---|---|---|
| Location of Regional Office | Fiscal year 1947 | Fiscal year 1946 | Percent increase or decrease | Fiscal year 1947 | Fiscal year 1946 | Percent increase or decrease | Fiscal year 1947 | Fiscal year 1946 | Percent increase or decrease |
| Total | 14,909 | 12,260 | +21.6 | 4,232 | 3,815 | +10.9 | 10,677 | 8,445 | +26.4 |
| Boston | 929 | 929 | .0 | 256 | 272 | -5.9 | 673 | 657 | +2.4 |
| New York | 1,866 | 1,506 | +23.9 | 675 | 504 | +33.9 | 1,191 | 1,002 | +18.9 |
| Buffalo | 420 | 398 | +5.5 | 128 | 134 | -4.5 | 292 | 264 | +10.6 |
| Philadelphia | 723 | 552 | +31.0 | 186 | 148 | +25.7 | 537 | 404 | +32.9 |
| Baltimore | 993 | 660 | +50.5 | 294 | 204 | +44.1 | 699 | 456 | +53.3 |
| Pittsburgh | 411 | 382 | +7.6 | 85 | 88 | -3.4 | 326 | 294 | +10.9 |
| Detroit | 537 | 436 | +23.2 | 174 | 153 | +13.7 | 363 | 283 | +28.3 |
| Cleveland | 599 | 572 | +4.7 | 170 | 193 | -11.9 | 429 | 379 | +13.2 |
| Cincinnati | 762 | 567 | +34.4 | 193 | 159 | +21.4 | 569 | 408 | +39.5 |
| Atlanta | 1,123 | 701 | +60.2 | 291 | 249 | +16.9 | 832 | 452 | +84.1 |
| Indianapolis | 227 | 354 | 49 | 103 | 178 | 251 | |||
| Chicago | 1,084 | 914 | +18.6 | 293 | 332 | -11.7 | 791 | 582 | +35.9 |
| St. Louis | 432 | 380 | +13.7 | 126 | 123 | +2.4 | 306 | 257 | +19.1 |
| New Orleans | 830 | 471 | +76.2 | 233 | 120 | +94.2 | 597 | 351 | +70.1 |
| Fort Worth | 747 | 605 | +23.5 | 185 | 164 | +12.8 | 562 | 441 | +27.4 |
| Kansas City | 548 | 493 | +11.2 | 147 | 145 | +1.4 | 401 | 348 | +15.2 |
| Minneapolis | 479 | 382 | +25.4 | 129 | 133 | -3.0 | 350 | 249 | +40.6 |
| Seattle | 519 | 430 | +20.7 | 135 | 99 | +36.4 | 384 | 331 | +16.0 |
| San Francisco | 659 | 585 | +12.6 | 181 | 184 | -1.6 | 478 | 401 | +19.2 |
| Los Angeles | 843 | 784 | +7.5 | 264 | 258 | +2.3 | 579 | 526 | +10.1 |
| Honolulu | 156 | 95 | +64.2 | 27 | 12 | +125.0 | 129 | 83 | +55.4 |
| San Juan | 21 | 64 | -67.2 | 10 | 38 | -73.7 | 11 | 26 | -57.7 |
- 1 Includes 1 case filed directly with the Board in Washington.
- 2 The Indianapolis Regional office was disestablished Nov. 30, 1946; the 1947 figure represents cases filed during 5 months.
0 of 138 figures sit in a row or column sum that works out.
Reader’s notes
p. 78. Ten columns: stub plus three panels of three (Fiscal year 1947, Fiscal year 1946, Percent increase or decrease) under "All cases", "Unfair labor practice cases" and "Representation cases". The stub heading "Location of Regional Office" spans both heading levels and is repeated in each. Footnote markers: in the Total row the raised 1 is printed to the LEFT of the figures (1 14,909 and 1 4,232); I have placed it after the value as 14,909^1 and 4,232^1. Likewise the Indianapolis 1947 all-cases figure is printed as "2 227" and transcribed as 227^2. The three "Percent increase or decrease" cells on the Indianapolis row each contain only a parenthesized raised 2, i.e. a footnote reference standing in for a value; transcribed as (^2). Boston's all-cases percent cell is printed without a leading zero or sign, as ".0"; transcribed as printed. Minus signs in the percent columns are printed as en-dashes/long hyphens; transcribed as plain "-". No printed value appeared doubtful, and every arithmetic relation checks out: unfair labor practice plus representation equals all cases on every row; the 1946 column sums match the printed totals exactly; the 1947 column sums (14,908 and 4,231) fall one short of the printed totals (14,909 and 4,232), which footnote 1 explains as the one case filed directly with the Board in Washington; and all 66 printed percent changes agree with the figures beside them.
Source image
Source data: U.S. NLRB Annual Reports (public domain). Reconstruction by NLRB Stats Archive. Read by claude-opus-5 (effort max, prompt extract_v1) from the 300-dpi scan; stitched by page. Updated October 2026.