NLRB Stats Archive › Annual Reports › FY1947 › Distribution of cases received during the fiscal year 1947, by industry
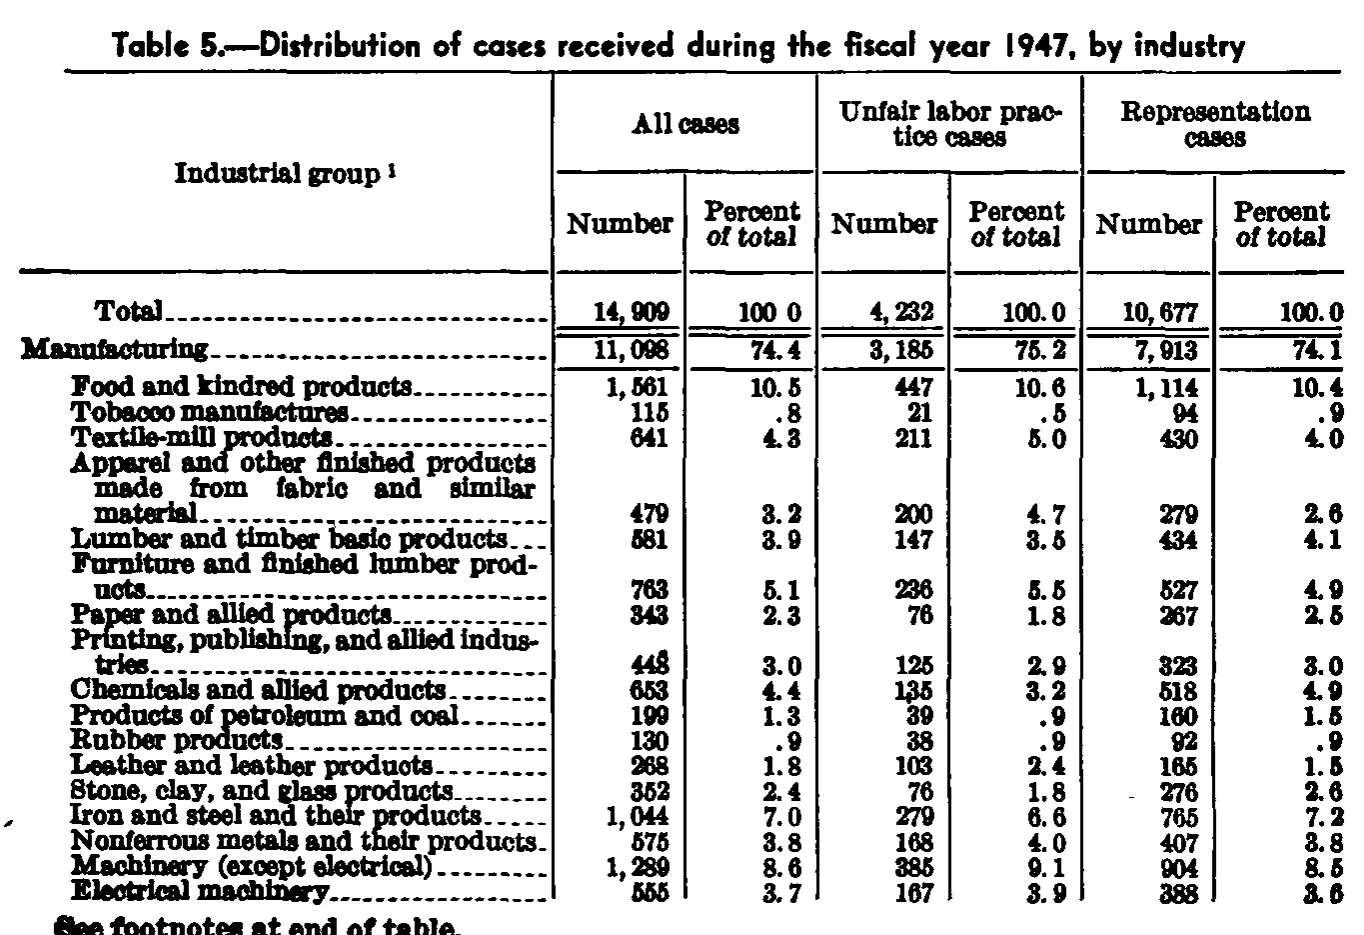
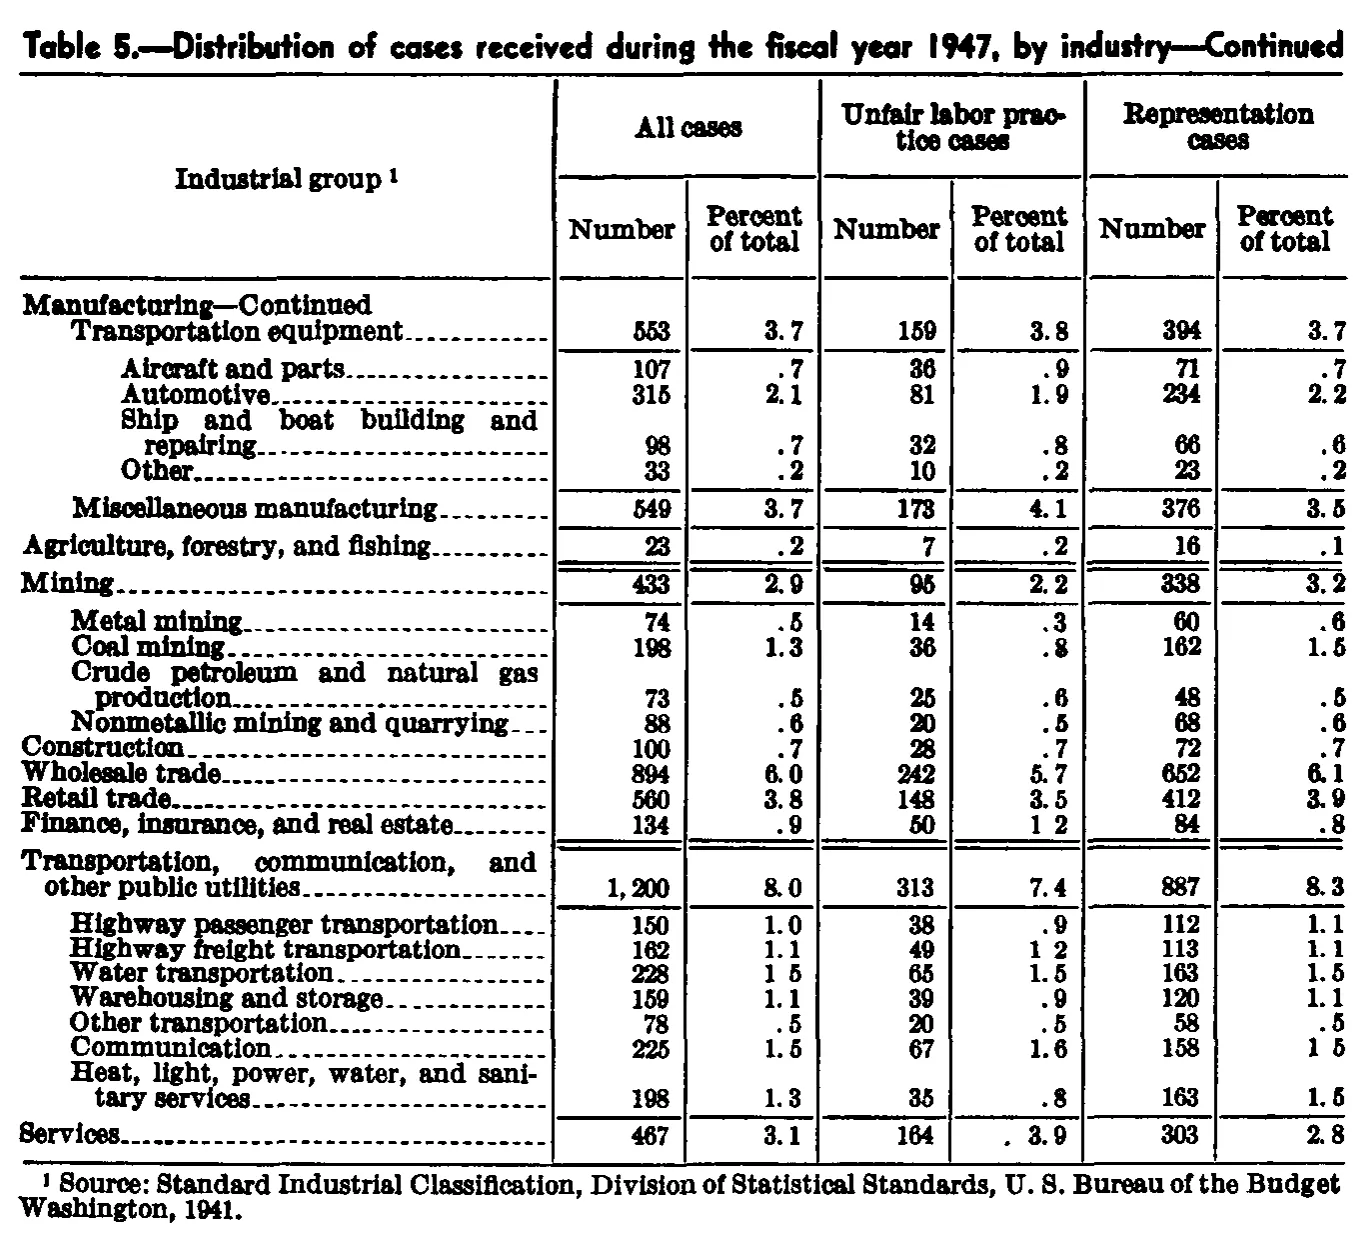
Distribution of cases received during the fiscal year 1947, by industry
Stitched from pp. 77–78.
| Industrial group | All cases | Unfair labor practice cases | Representation cases | |||
|---|---|---|---|---|---|---|
| Industrial group | Number | Percent of total | Number | Percent of total | Number | Percent of total |
| Total | 14,909 | 100.0 | 4,232 | 100.0 | 10,677 | 100.0 |
| Manufacturing | 11,098 | 74.4 | 3,185 | 75.2 | 7,913 | 74.1 |
| Food and kindred products | 1,561 | 10.5 | 447 | 10.6 | 1,114 | 10.4 |
| Tobacco manufactures | 115 | .8 | 21 | .5 | 94 | .9 |
| Textile-mill products | 641 | 4.3 | 211 | 5.0 | 430 | 4.0 |
| Apparel and other finished products made from fabric and similar material | 479 | 3.2 | 200 | 4.7 | 279 | 2.6 |
| Lumber and timber basic products | 581 | 3.9 | 147 | 3.5 | 434 | 4.1 |
| Furniture and finished lumber products | 763 | 5.1 | 236 | 5.5 | 527 | 4.9 |
| Paper and allied products | 343 | 2.3 | 76 | 1.8 | 267 | 2.5 |
| Printing, publishing, and allied industries | 448 | 3.0 | 125 | 2.9 | 323 | 3.0 |
| Chemicals and allied products | 653 | 4.4 | 135 | 3.2 | 518 | 4.9 |
| Products of petroleum and coal | 199 | 1.3 | 39 | .9 | 160 | 1.5 |
| Rubber products | 130 | .9 | 38 | .9 | 92 | .9 |
| Leather and leather products | 268 | 1.8 | 103 | 2.4 | 165 | 1.5 |
| Stone, clay, and glass products | 352 | 2.4 | 76 | 1.8 | 276 | 2.6 |
| Iron and steel and their products | 1,044 | 7.0 | 279 | 6.6 | 765 | 7.2 |
| Nonferrous metals and their products | 575 | 3.8 | 168 | 4.0 | 407 | 3.8 |
| Machinery (except electrical) | 1,289 | 8.6 | 385 | 9.1 | 904 | 8.5 |
| Electrical machinery | 555 | 3.7 | 167 | 3.9 | 388 | 3.6 |
| Manufacturing—Continued | ||||||
| Transportation equipment | 553 | 3.7 | 159 | 3.8 | 394 | 3.7 |
| Aircraft and parts | 107 | .7 | 36 | .9 | 71 | .7 |
| Automotive | 315 | 2.1 | 81 | 1.9 | 234 | 2.2 |
| Ship and boat building and repairing | 98 | .7 | 32 | .8 | 66 | .6 |
| Other | 33 | .2 | 10 | .2 | 23 | .2 |
| Miscellaneous manufacturing | 549 | 3.7 | 173 | 4.1 | 376 | 3.5 |
| Agriculture, forestry, and fishing | 23 | .2 | 7 | .2 | 16 | .1 |
| Mining | 433 | 2.9 | 95 | 2.2 | 338 | 3.2 |
| Metal mining | 74 | .5 | 14 | .3 | 60 | .6 |
| Coal mining | 198 | 1.3 | 36 | .8 | 162 | 1.5 |
| Crude petroleum and natural gas production | 73 | .5 | 25 | .6 | 48 | .5 |
| Nonmetallic mining and quarrying | 88 | .6 | 20 | .5 | 68 | .6 |
| Construction | 100 | .7 | 28 | .7 | 72 | .7 |
| Wholesale trade | 894 | 6.0 | 242 | 5.7 | 652 | 6.1 |
| Retail trade | 560 | 3.8 | 148 | 3.5 | 412 | 3.9 |
| Finance, insurance, and real estate | 134 | .9 | 50 | 1.2 | 84 | .8 |
| Transportation, communication, and other public utilities | 1,200 | 8.0 | 313 | 7.4 | 887 | 8.3 |
| Highway passenger transportation | 150 | 1.0 | 38 | .9 | 112 | 1.1 |
| Highway freight transportation | 162 | 1.1 | 49 | 1.2 | 113 | 1.1 |
| Water transportation | 228 | 1.5 | 65 | 1.5 | 163 | 1.5 |
| Warehousing and storage | 159 | 1.1 | 39 | .9 | 120 | 1.1 |
| Other transportation | 78 | .5 | 20 | .5 | 58 | .5 |
| Communication | 225 | 1.5 | 67 | 1.6 | 158 | 1.5 |
| Heat, light, power, water, and sanitary services | 198 | 1.3 | 35 | .8 | 163 | 1.5 |
| Services | 467 | 3.1 | 164 | 3.9 | 303 | 2.8 |
- 1 Source: Standard Industrial Classification, Division of Statistical Standards, U. S. Bureau of the Budget Washington, 1941.
132 of 132 figures sit in a row or column sum that works out.
Reader’s notes
p. 77. The crop is the first page of the table: it ends after "Electrical machinery" and is followed by the continuation line "See footnotes at end of table." (not transcribed as a footnote, since no footnote text appears on this image; the marker 1 on the stub heading is defined at the end of the table on a later page). Doubtful cells: (a) Total row, "All cases / Percent of total" — printed as "100 0", the decimal point having dropped out of the scan; transcribed as "100.0" to match the other three total-row percentages. (b) Textile-mill products, "Unfair labor practice cases / Percent of total" — the first glyph is degraded and could read 5 or 6; transcribed as "5.0". (c) Stone, clay, and glass products, "Representation cases / Number" — a short stray dash-like mark sits to the left of "276" in the margin of the column; it is scan noise, not a minus sign. Internal consistency check: in every data row the unfair-labor-practice and representation Number cells sum exactly to the All cases Number, and those sum to the Manufacturing and Total lines as printed, which supports the digits transcribed. All percentages agree with the printed counts to the nearest tenth.
p. 78. This is a continuation page (caption reads "—Continued"); the body opens with the section line "Manufacturing—Continued", so the manufacturing detail rows above it are on the previous page. Faint/broken decimal points: in several percent cells the decimal point did not print or printed as a gap, appearing as "1 2" or "1 5". Affected cells, all transcribed with the decimal point restored because the column context and the surrounding digits make the reading unambiguous: "Finance, insurance, and real estate" / Unfair labor practice cases-Percent of total (printed "1 2", given as 1.2); "Highway freight transportation" / Unfair labor practice cases-Percent of total (printed "1 2", given as 1.2); "Water transportation" / All cases-Percent of total (printed "1 5", given as 1.5); "Communication" / Representation cases-Percent of total (printed "1 5", given as 1.5). "Services" / Unfair labor practice cases-Percent of total is printed as ". 3. 9" — there is a stray dot to the left of the figure, most likely a leader-dot or ink artifact rather than part of the value; transcribed as 3.9. The footnote is printed without a comma between "Budget" and "Washington"; transcribed as printed. Internal arithmetic checks pass throughout: for every row, All cases Number = Unfair labor practice Number + Representation Number, and each group's component rows sum to the group line (e.g. Transportation equipment 107+315+98+33 = 553; Mining 74+198+73+88 = 433; Transportation, communication, and other public utilities 150+162+228+159+78+225+198 = 1,200). No misprints detected in the counts.
Source image
Source data: U.S. NLRB Annual Reports (public domain). Reconstruction by NLRB Stats Archive. Read by claude-opus-5 (effort max, prompt extract_v1) from the 300-dpi scan; stitched by page. Updated October 2026.