NLRB Stats Archive › Annual Reports › FY1947 › Distribution of cases received — by industry
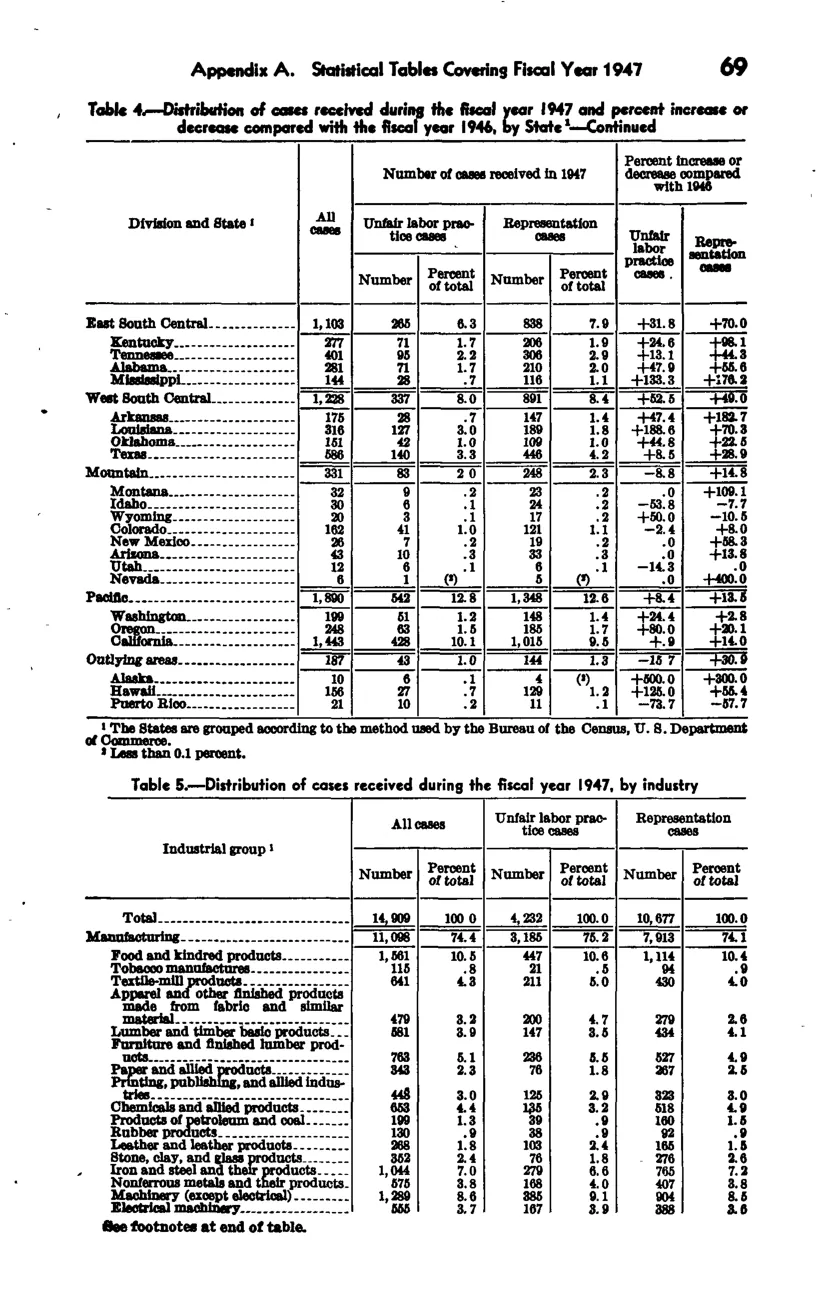
Distribution of cases received — by industry
| Total | 14 909 | 100 0 | 4,232 | 100 | 10,677 | 100 |
|---|---|---|---|---|---|---|
| Manufacturing | 11,098 | 74.4 | 3,185 | 75.2 | 7,913 | 74.1 |
| Food and kindred products | 1,561 | 10.5 | 447 | 10.6 | 1,114 | 10.4 |
| Tobacco manufactures | 115 | 0.8 | 21 | 0.5 | 94 | 0.9 |
| Textile-mill products | 641 | 4.3 | 211 | 5 | 430 | 4 |
| Apparel and other finished products made from fabric and similar material | 479 | 3.2 | 200 | 4.7 | 279 | 2.6 |
| Lumber and timber imolo products_ | 581 | 3.9 | 147 | 8.5 | 434 | 4.1 |
| Furniture and finished lumber prod- ucts | 783 | 5.1 | 238 | 5.5 | 527 | 4.9 |
| Paw and allied products | 343 | 2.3 | 76 | 1.8 | 247 | 2.6 |
| Printing, publishing, and allied indus- tries | 44E | 3 | 125 | 2.9 | 323 | 3 |
| Chemicals and allied products | 663 | 4.4 | 135 | 3.2 | 518 | 4.9 |
| Products of petroleum and coal | 199 | 1.3 | 39 | 0.9 | 160 | 1.5 |
| Rubber products | 130 | 0.9 | as | 0.9 | 92 | |
| Leather and leather products | 268 | 1.8 | 103 | 2.4 | 165 | 1.5 |
| Stone, clay, and glen products | 352 | 2.4 | 76 | 1.8 | 278 | 2.6 |
| Iron and steel and their products | 1,044 | 7 | 279 | 6. | 765 | 7.2 |
| Nonferrous metals and their products_ | 575 | 8.8 | 168 | 4 | 407 | 8.8 |
| Machinery (except electrical) | 1,289 | 8.6 | 386 | 9.1 | 904 | 8.6 |
| Electrical machinery | 655 | I 7 | 107 | 3.9 | 388 | 8.6 |
Source image
Source data: U.S. NLRB Annual Reports (public domain). Reconstruction by NLRB Stats Archive. Updated June 2026.