NLRB Stats Archive › Annual Reports › FY1946 › Number of elections and cross checks and number of valid votes cast during the fiscal year 1946, by industry
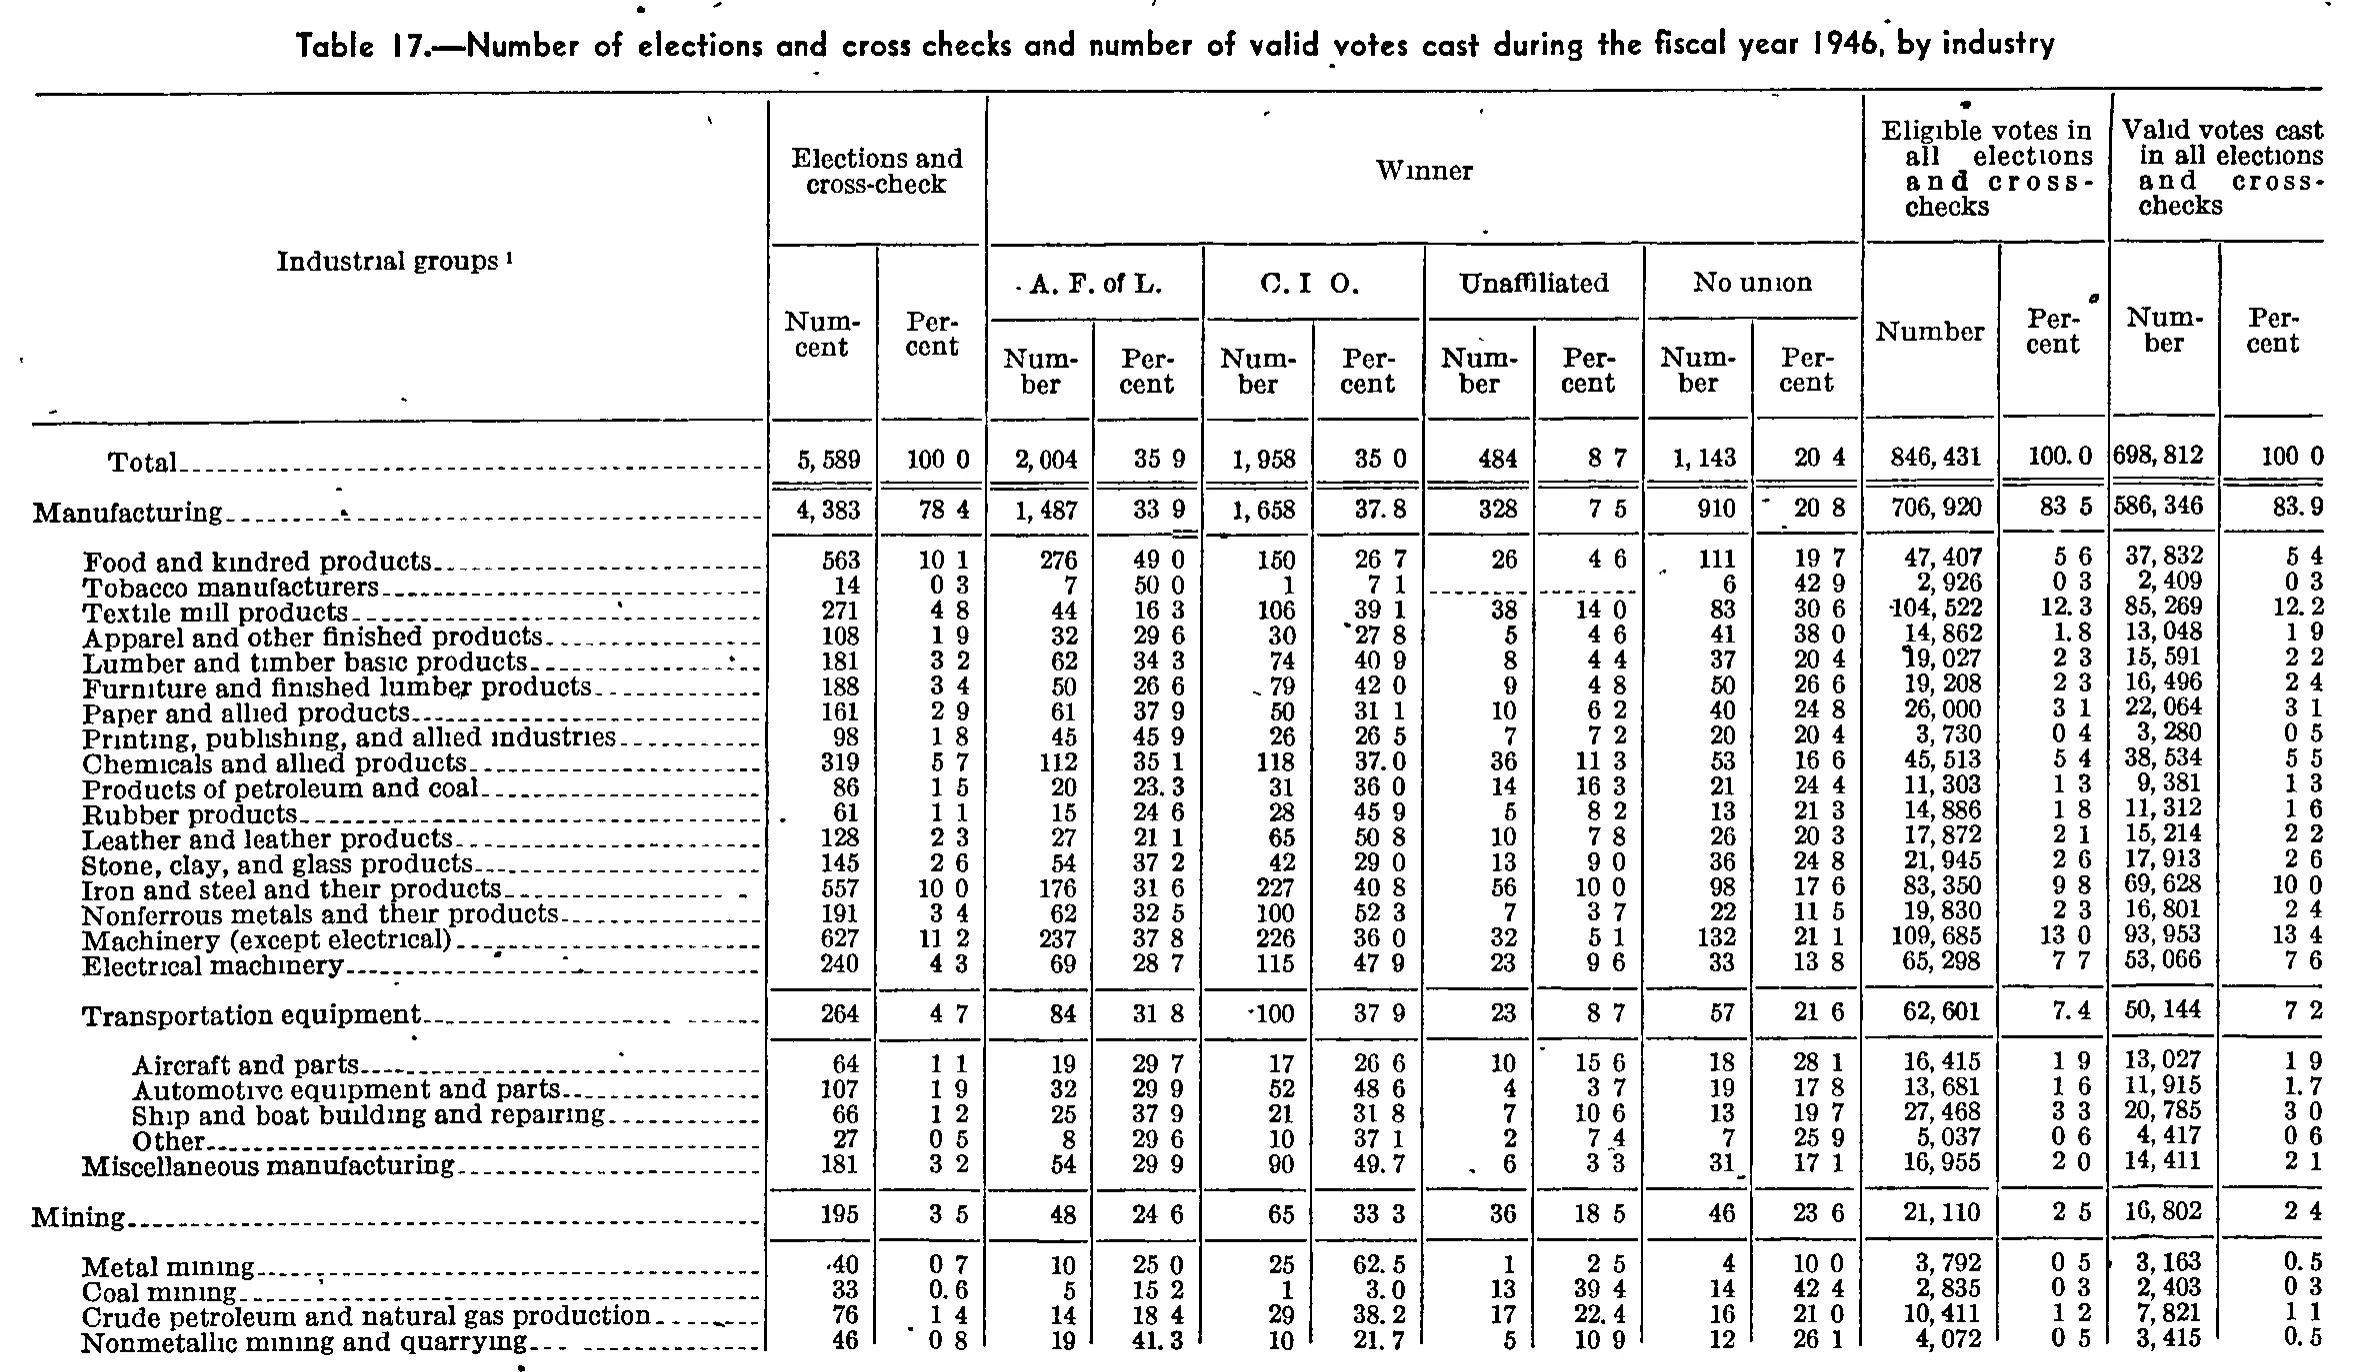
Number of elections and cross checks and number of valid votes cast during the fiscal year 1946, by industry
Stitched from pp. 121–122.
| Industrial groups | Elections and cross-check | Winner | Eligible votes in all elections and cross-checks | Valid votes cast in all elections and cross-checks | ||||||||||
|---|---|---|---|---|---|---|---|---|---|---|---|---|---|---|
| Industrial groups | Number | Percent | A. F. of L. | C. I. O. | Unaffiliated | No union | Number | Percent | Number | Percent | ||||
| Industrial groups | Number | Percent | Number | Percent | Number | Percent | Number | Percent | Number | Percent | Number | Percent | Number | Percent |
| Total | 5,589 | 100.0 | 2,004 | 35.9 | 1,958 | 35.0 | 484 | 8.7 | 1,143 | 20.4 | 846,431 | 100.0 | 698,812 | 100.0 |
| Manufacturing | 4,383 | 78.4 | 1,487 | 33.9 | 1,658 | 37.8 | 328 | 7.5 | 910 | 20.8 | 706,920 | 83.5 | 586,346 | 83.9 |
| Food and kindred products | 563 | 10.1 | 276 | 49.0 | 150 | 26.7 | 26 | 4.6 | 111 | 19.7 | 47,407 | 5.6 | 37,832 | 5.4 |
| Tobacco manufacturers | 14 | 0.3 | 7 | 50.0 | 1 | 7.1 | 6 | 42.9 | 2,926 | 0.3 | 2,409 | 0.3 | ||
| Textile mill products | 271 | 4.8 | 44 | 16.3 | 106 | 39.1 | 38 | 14.0 | 83 | 30.6 | 104,522 | 12.3 | 85,269 | 12.2 |
| Apparel and other finished products | 108 | 1.9 | 32 | 29.6 | 30 | 27.8 | 5 | 4.6 | 41 | 38.0 | 14,862 | 1.8 | 13,048 | 1.9 |
| Lumber and timber basic products | 181 | 3.2 | 62 | 34.3 | 74 | 40.9 | 8 | 4.4 | 37 | 20.4 | 19,027 | 2.3 | 15,591 | 2.2 |
| Furniture and finished lumber products | 188 | 3.4 | 50 | 26.6 | 79 | 42.0 | 9 | 4.8 | 50 | 26.6 | 19,208 | 2.3 | 16,496 | 2.4 |
| Paper and allied products | 161 | 2.9 | 61 | 37.9 | 50 | 31.1 | 10 | 6.2 | 40 | 24.8 | 26,000 | 3.1 | 22,064 | 3.1 |
| Printing, publishing, and allied industries | 98 | 1.8 | 45 | 45.9 | 26 | 26.5 | 7 | 7.2 | 20 | 20.4 | 3,730 | 0.4 | 3,280 | 0.5 |
| Chemicals and allied products | 319 | 5.7 | 112 | 35.1 | 118 | 37.0 | 36 | 11.3 | 53 | 16.6 | 45,513 | 5.4 | 38,534 | 5.5 |
| Products of petroleum and coal | 86 | 1.5 | 20 | 23.3 | 31 | 36.0 | 14 | 16.3 | 21 | 24.4 | 11,303 | 1.3 | 9,381 | 1.3 |
| Rubber products | 61 | 1.1 | 15 | 24.6 | 28 | 45.9 | 5 | 8.2 | 13 | 21.3 | 14,886 | 1.8 | 11,312 | 1.6 |
| Leather and leather products | 128 | 2.3 | 27 | 21.1 | 65 | 50.8 | 10 | 7.8 | 26 | 20.3 | 17,872 | 2.1 | 15,214 | 2.2 |
| Stone, clay, and glass products | 145 | 2.6 | 54 | 37.2 | 42 | 29.0 | 13 | 9.0 | 36 | 24.8 | 21,945 | 2.6 | 17,913 | 2.6 |
| Iron and steel and their products | 557 | 10.0 | 176 | 31.6 | 227 | 40.8 | 56 | 10.0 | 98 | 17.6 | 83,350 | 9.8 | 69,628 | 10.0 |
| Nonferrous metals and their products | 191 | 3.4 | 62 | 32.5 | 100 | 52.3 | 7 | 3.7 | 22 | 11.5 | 19,830 | 2.3 | 16,801 | 2.4 |
| Machinery (except electrical) | 627 | 11.2 | 237 | 37.8 | 226 | 36.0 | 32 | 5.1 | 132 | 21.1 | 109,685 | 13.0 | 93,953 | 13.4 |
| Electrical machinery | 240 | 4.3 | 69 | 28.7 | 115 | 47.9 | 23 | 9.6 | 33 | 13.8 | 65,298 | 7.7 | 53,066 | 7.6 |
| Transportation equipment | 264 | 4.7 | 84 | 31.8 | 100 | 37.9 | 23 | 8.7 | 57 | 21.6 | 62,601 | 7.4 | 50,144 | 7.2 |
| Aircraft and parts | 64 | 1.1 | 19 | 29.7 | 17 | 26.6 | 10 | 15.6 | 18 | 28.1 | 16,415 | 1.9 | 13,027 | 1.9 |
| Automotive equipment and parts | 107 | 1.9 | 32 | 29.9 | 52 | 48.6 | 4 | 3.7 | 19 | 17.8 | 13,681 | 1.6 | 11,915 | 1.7 |
| Ship and boat building and repairing | 66 | 1.2 | 25 | 37.9 | 21 | 31.8 | 7 | 10.6 | 13 | 19.7 | 27,468 | 3.3 | 20,785 | 3.0 |
| Other | 27 | 0.5 | 8 | 29.6 | 10 | 37.1 | 2 | 7.4 | 7 | 25.9 | 5,037 | 0.6 | 4,417 | 0.6 |
| Miscellaneous manufacturing | 181 | 3.2 | 54 | 29.9 | 90 | 49.7 | 6 | 3.3 | 31 | 17.1 | 16,955 | 2.0 | 14,411 | 2.1 |
| Mining | 195 | 3.5 | 48 | 24.6 | 65 | 33.3 | 36 | 18.5 | 46 | 23.6 | 21,110 | 2.5 | 16,802 | 2.4 |
| Metal mining | 40 | 0.7 | 10 | 25.0 | 25 | 62.5 | 1 | 2.5 | 4 | 10.0 | 3,792 | 0.5 | 3,163 | 0.5 |
| Coal mining | 33 | 0.6 | 5 | 15.2 | 1 | 3.0 | 13 | 39.4 | 14 | 42.4 | 2,835 | 0.3 | 2,403 | 0.3 |
| Crude petroleum and natural gas production | 76 | 1.4 | 14 | 18.4 | 29 | 38.2 | 17 | 22.4 | 16 | 21.0 | 10,411 | 1.2 | 7,821 | 1.1 |
| Nonmetallic mining and quarrying | 46 | 0.8 | 19 | 41.3 | 10 | 21.7 | 5 | 10.9 | 12 | 26.1 | 4,072 | 0.5 | 3,415 | 0.5 |
| Construction | 30 | 0.5 | 21 | 70.0 | 3 | 10.0 | 3 | 10.0 | 3 | 10.0 | 2,419 | 0.3 | 1,828 | 0.3 |
| Wholesale trade | 202 | 3.6 | 84 | 41.6 | 55 | 27.2 | 17 | 8.4 | 46 | 22.8 | 11,659 | 1.4 | 9,360 | 1.3 |
| Retail trade | 153 | 2.8 | 87 | 56.9 | 35 | 22.9 | 3 | 1.9 | 28 | 18.3 | 15,727 | 1.9 | 12,215 | 1.7 |
| Finance, insurance, and real estate | 51 | 0.9 | 23 | 45.1 | 6 | 11.8 | 3 | 5.9 | 19 | 37.2 | 6,226 | 0.7 | 5,421 | 0.8 |
| Transportation, communication, and other public utilities | 459 | 8.2 | 199 | 43.3 | 100 | 21.8 | 89 | 19.4 | 71 | 15.5 | 71,510 | 8.4 | 58,604 | 8.4 |
| Highway passenger transportation | 42 | 0.8 | 21 | 50.0 | 1 | 2.4 | 6 | 14.3 | 14 | 33.3 | 2,259 | 0.3 | 1,924 | 0.3 |
| Highway freight transportation | 51 | 0.9 | 37 | 72.6 | 4 | 7.8 | 1 | 2.0 | 9 | 17.6 | 1,284 | 0.1 | 1,032 | 0.1 |
| Water transportation | 88 | 1.6 | 16 | 18.2 | 36 | 40.9 | 23 | 26.1 | 13 | 14.8 | 5,132 | 0.6 | 3,940 | 0.6 |
| Warehousing and storage | 57 | 1.0 | 23 | 40.3 | 25 | 43.9 | 3 | 5.3 | 6 | 10.5 | 1,823 | 0.2 | 1,553 | 0.2 |
| Other transportation | 35 | 0.6 | 11 | 31.5 | 11 | 31.4 | 4 | 11.4 | 9 | 25.7 | 6,067 | 0.7 | 5,290 | 0.8 |
| Communication | 78 | 1.4 | 32 | 41.0 | 4 | 5.1 | 33 | 42.3 | 9 | 11.6 | 15,955 | 1.9 | 10,620 | 1.5 |
| Heat, light, power, water, and sanitary service | 108 | 1.9 | 59 | 54.6 | 19 | 17.6 | 19 | 17.6 | 11 | 10.2 | 38,990 | 4.6 | 34,245 | 4.9 |
| Services | 116 | 2.1 | 55 | 47.4 | 36 | 31.0 | 5 | 4.3 | 20 | 17.3 | 10,860 | 1.3 | 8,236 | 1.2 |
300 of 300 figures sit in a row or column sum that works out.
Reader’s notes
p. 121. 15 columns: stub + "Elections and cross-check" (Number, Percent) + "Winner" (A. F. of L., C. I. O., Unaffiliated, No union, each Number/Percent) + "Eligible votes..." (Number, Percent) + "Valid votes cast..." (Number, Percent). Scan quality: this is a 1-bit scan in which many periods did not survive. The great majority of percent cells print as e.g. "100 0", "35 9", "8 7" with a blank where the decimal point belongs, while a minority print the point clearly ("37.8", "100.0", "83.9", "62.5", "3.0", "38.2", "22.4", "49.7", "7.4", "1.7", "0.5"). Since every percent column is a one-decimal percentage and the same font shows the point elsewhere, I restored the dropped decimal point in all percent cells. No digits were altered. For the same reason I wrote the Winner sub-heading as "C. I. O."; on the image the period after the "I" has dropped out, so it reads "C. I O.". Heading anomaly: the first sub-heading under "Elections and cross-check" is printed as "Num-" over "cent" rather than "Num-" over "ber". Every parallel column reads "Number", so this is a misprint or broken type; I transcribed it as "Number". Tobacco manufacturers: the Unaffiliated Number and Percent cells carry a single dash rule spanning both, transcribed as two empty cells. Stray ink marks sit beside several figures and were not transcribed as characters: a leading dot before "100" (Transportation equipment, C. I. O. Number), before "104,522" and "19,027" (Eligible votes Number), and before "40" (Metal mining, Elections Number). Likewise an apostrophe-like mark precedes "20 8" in the Manufacturing No union Percent cell. The crop cuts the table off after "Nonmetallic mining and quarrying" — the body continues beyond this image, and the text of footnote 1 (marked on the stub heading "Industrial groups 1") is not shown, so `footnotes` is empty. Arithmetic not checked or corrected, per instructions; note that the Winner Number cells for Total (2,004 + 1,958 + 484 + 1,143) sum to 5,589, matching the Total elections figure.
p. 122. Crop is a continuation page: no column headings are printed on this image, so header_rows is empty. The grid is 15 columns (stub + 14), printed as seven number/percent pairs separated by column rules; the first pair is a case count and its percent, the next four pairs are a breakdown of those cases with their percents, and the last two pairs are employee counts with percents. Decimal points: this is a 1-bit scan in which the decimal point of most one-place percentages failed to reproduce, printing as a gap (e.g. "0 5", "70 0", "41 6"). A minority of cells show the point clearly ("11.8", "1.9", "18.2", "31.5", "2.1", "8.2", "43.3", "0.2", "1.5"). I have written every percentage cell with its decimal point, by analogy with the comma-space rule. No digits were altered. Cross-checks all pass, which supports the column assignment: within each row the four breakdown counts sum to the row's case count (e.g. Water transportation 16+36+23+13 = 88) and the four percents sum to 100.0; the seven transportation sub-rows sum to the "Transportation, communication, and other public utilities" line in every one of the 14 columns (459, 199, 100, 89, 71, 71,510 and 58,604 all reconcile exactly). "Other transportation", column 4 (first percent of the breakdown) reads 31.5 while column 6 reads 31.4, although both sit over the same count of 11 out of 35 (= 31.43). This is almost certainly a deliberate rounding adjustment rather than a misprint: 31.4+31.4+11.4+25.7 = 99.9, and bumping one cell to 31.5 makes the row sum to 100.0 as every other row does. Transcribed as printed. "Services", column 10, reads 17.3 where 20/116 = 17.24; same pattern (47.4+31.0+4.3+17.2 = 99.9), also transcribed as printed. "Highway freight transportation", column 9, has a small ink speck to the right of the 9; the value is 9, confirmed by the column total of 71. Similar stray specks sit left of 43.3 (Transportation row, column 4), left of 22.9 (Retail trade, column 6), left of 9,360 (Wholesale trade, column 13) and left of the stub on several lines; none are footnote markers and none were transcribed. The crop is cut at both ends: the table continues above "Construction" (earlier industry rows and the headings are on the preceding part of the page), and the closing double rule is at the bottom edge with only faint fragments visible below it, so any footnotes printed under the table are outside the crop. No footnote markers appear on any row label or value within the crop.
Source image

Source data: U.S. NLRB Annual Reports (public domain). Reconstruction by NLRB Stats Archive. Read by claude-opus-5 (effort max, prompt extract_v1) from the 300-dpi scan; stitched by page. Updated October 2026.