NLRB Stats Archive › Annual Reports › FY1946 › Regional distribution of cases received during the fiscal year 1946, compared with 1945
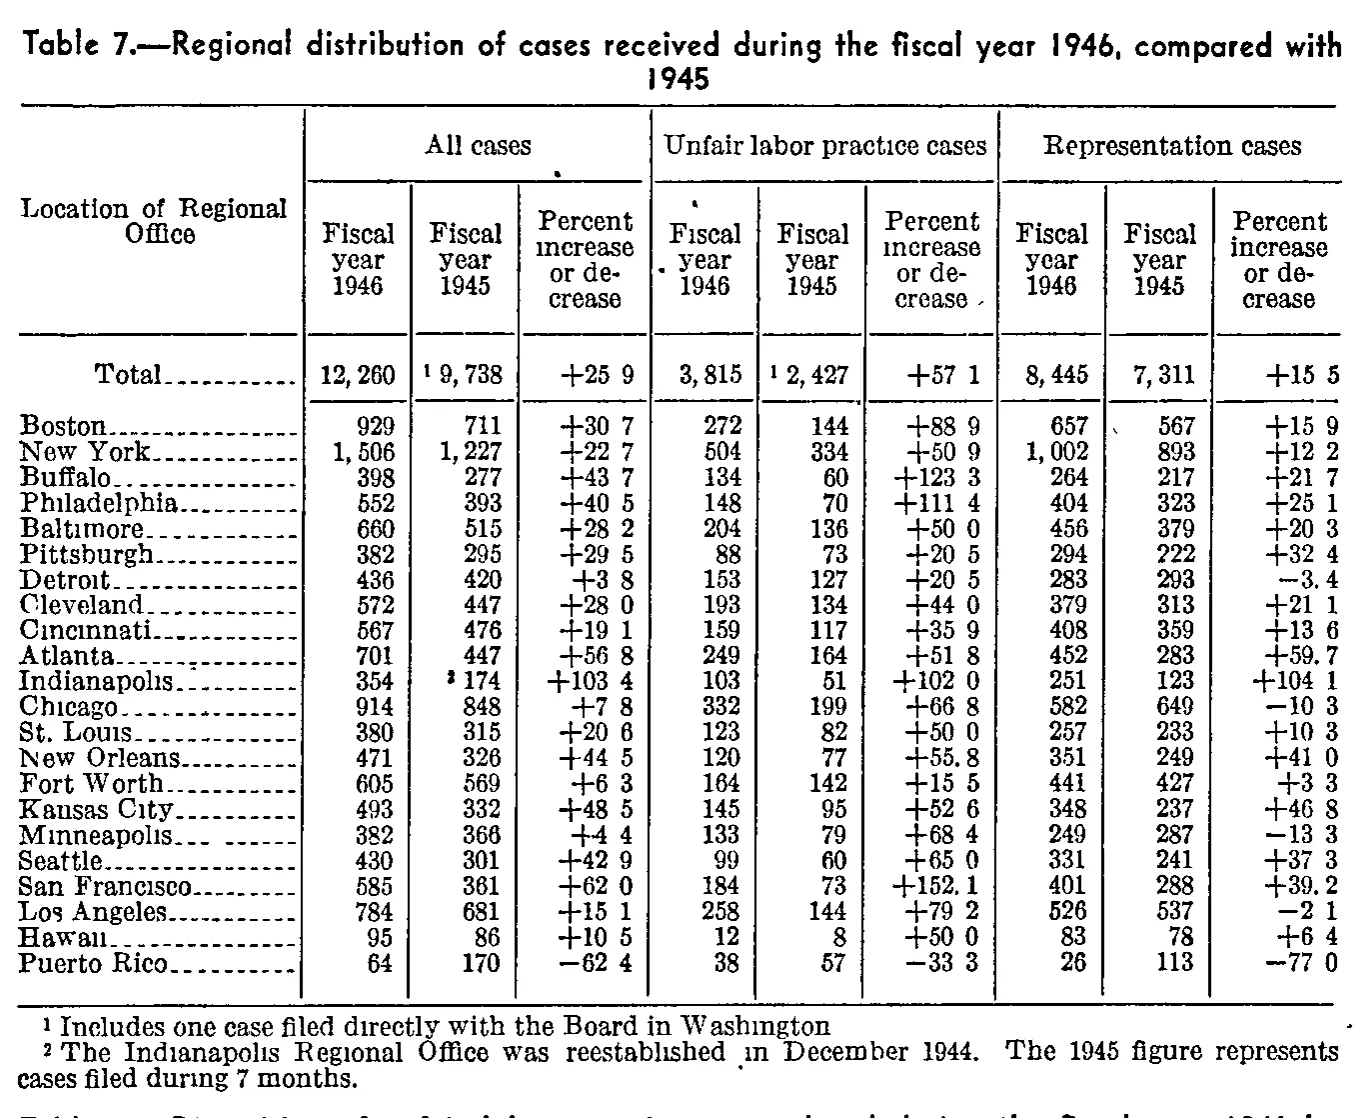
Regional distribution of cases received during the fiscal year 1946, compared with 1945
| Location of Regional Office | All cases | Unfair labor practice cases | Representation cases | ||||||
|---|---|---|---|---|---|---|---|---|---|
| Location of Regional Office | Fiscal year 1946 | Fiscal year 1945 | Percent increase or decrease | Fiscal year 1946 | Fiscal year 1945 | Percent increase or decrease | Fiscal year 1946 | Fiscal year 1945 | Percent increase or decrease |
| Total | 12,260 | 9,738 | +25.9 | 3,815 | 2,427 | +57.1 | 8,445 | 7,311 | +15.5 |
| Boston | 929 | 711 | +30.7 | 272 | 144 | +88.9 | 657 | 567 | +15.9 |
| New York | 1,506 | 1,227 | +22.7 | 504 | 334 | +50.9 | 1,002 | 893 | +12.2 |
| Buffalo | 398 | 277 | +43.7 | 134 | 60 | +123.3 | 264 | 217 | +21.7 |
| Philadelphia | 552 | 393 | +40.5 | 148 | 70 | +111.4 | 404 | 323 | +25.1 |
| Baltimore | 660 | 515 | +28.2 | 204 | 136 | +50.0 | 456 | 379 | +20.3 |
| Pittsburgh | 382 | 295 | +29.5 | 88 | 73 | +20.5 | 294 | 222 | +32.4 |
| Detroit | 436 | 420 | +3.8 | 153 | 127 | +20.5 | 283 | 293 | -3.4 |
| Cleveland | 572 | 447 | +28.0 | 193 | 134 | +44.0 | 379 | 313 | +21.1 |
| Cincinnati | 567 | 476 | +19.1 | 159 | 117 | +35.9 | 408 | 359 | +13.6 |
| Atlanta | 701 | 447 | +56.8 | 249 | 164 | +51.8 | 452 | 283 | +59.7 |
| Indianapolis | 354 | 174 | +103.4 | 103 | 51 | +102.0 | 251 | 123 | +104.1 |
| Chicago | 914 | 848 | +7.8 | 332 | 199 | +66.8 | 582 | 649 | -10.3 |
| St. Louis | 380 | 315 | +20.6 | 123 | 82 | +50.0 | 257 | 233 | +10.3 |
| New Orleans | 471 | 326 | +44.5 | 120 | 77 | +55.8 | 351 | 249 | +41.0 |
| Fort Worth | 605 | 569 | +6.3 | 164 | 142 | +15.5 | 441 | 427 | +3.3 |
| Kansas City | 493 | 332 | +48.5 | 145 | 95 | +52.6 | 348 | 237 | +46.8 |
| Minneapolis | 382 | 366 | +4.4 | 133 | 79 | +68.4 | 249 | 287 | -13.3 |
| Seattle | 430 | 301 | +42.9 | 99 | 60 | +65.0 | 331 | 241 | +37.3 |
| San Francisco | 585 | 361 | +62.0 | 184 | 73 | +152.1 | 401 | 288 | +39.2 |
| Los Angeles | 784 | 681 | +15.1 | 258 | 144 | +79.2 | 526 | 537 | -2.1 |
| Hawaii | 95 | 86 | +10.5 | 12 | 8 | +50.0 | 83 | 78 | +6.4 |
| Puerto Rico | 64 | 170 | -62.4 | 38 | 57 | -33.3 | 26 | 113 | -77.0 |
- 1 Includes one case filed directly with the Board in Washington
- 2 The Indianapolis Regional Office was reestablished in December 1944. The 1945 figure represents cases filed during 7 months.
0 of 138 figures sit in a row or column sum that works out.
Reader’s notes
p. 114. Decimal points in the three "Percent increase or decrease" columns: the scan has dropped most of the periods, so the majority of these cells appear as e.g. "+25 9" with a gap where the point belongs. The same scan degradation drops the dots on lower-case i's throughout (e.g. "Fiscal", "Cincinnati", "Hawaii", "St. Louis" all print dotless). A few decimal points did survive and are clearly visible (Detroit representation -3.4, Atlanta representation +59.7, New Orleans unfair labor practice +55.8, San Francisco unfair labor practice +152.1 and representation +39.2), and every percent cell carries exactly one digit after the gap, so I have transcribed all of them with a decimal point. Verification: all six integer columns were summed and every one reconciles with the printed Total row. All cases 1946 sums to 12,260; unfair labor practice 1946 to 3,815; representation 1946 to 8,445; representation 1945 to 7,311 — all exact. All cases 1945 sums to 9,737 and unfair labor practice 1945 to 2,426, each one short of the printed 9,738 and 2,427, which is exactly what footnote 1 ("Includes one case filed directly with the Board in Washington") accounts for. Row-wise, 1946 and 1945 unfair labor practice plus representation also add to the all-cases figures. This gives high confidence in the digits and column placement of the count columns. Three percent cells do not match the counts beside them to the printed rounding, and are transcribed as printed rather than corrected: Total, unfair labor practice percent reads +57.1 where 2,427 to 3,815 gives +57.2; Minneapolis, representation percent reads -13.3 where 287 to 249 gives -13.2; Los Angeles, representation percent reads -2.1 where 537 to 526 gives -2.0. In each the final digit is small and slightly broken in the scan, so these may be either misprints in the original or misreadings of a degraded glyph. Footnote markers: the raised 1 is printed to the left of the value in both Total-row 1945 cells, and the raised 2 to the left of the Indianapolis 1945 figure 174; all three are placed after the value in this grid per the convention. Footnote 1 shows no terminating period in the image. A further line of type is clipped at the very bottom edge of the crop, below footnote 2 — it is the caption of the next table (Table 8), not part of this table, and is omitted.
Source image
Source data: U.S. NLRB Annual Reports (public domain). Reconstruction by NLRB Stats Archive. Read by claude-opus-5 (effort max, prompt extract_v1) from the 300-dpi scan; stitched by page. Updated October 2026.