NLRB Stats Archive › Annual Reports › FY1946 › Distribution of cases received during the fiscal year 1946 and percent increase or decrease compared with the fiscal year 1945, by States
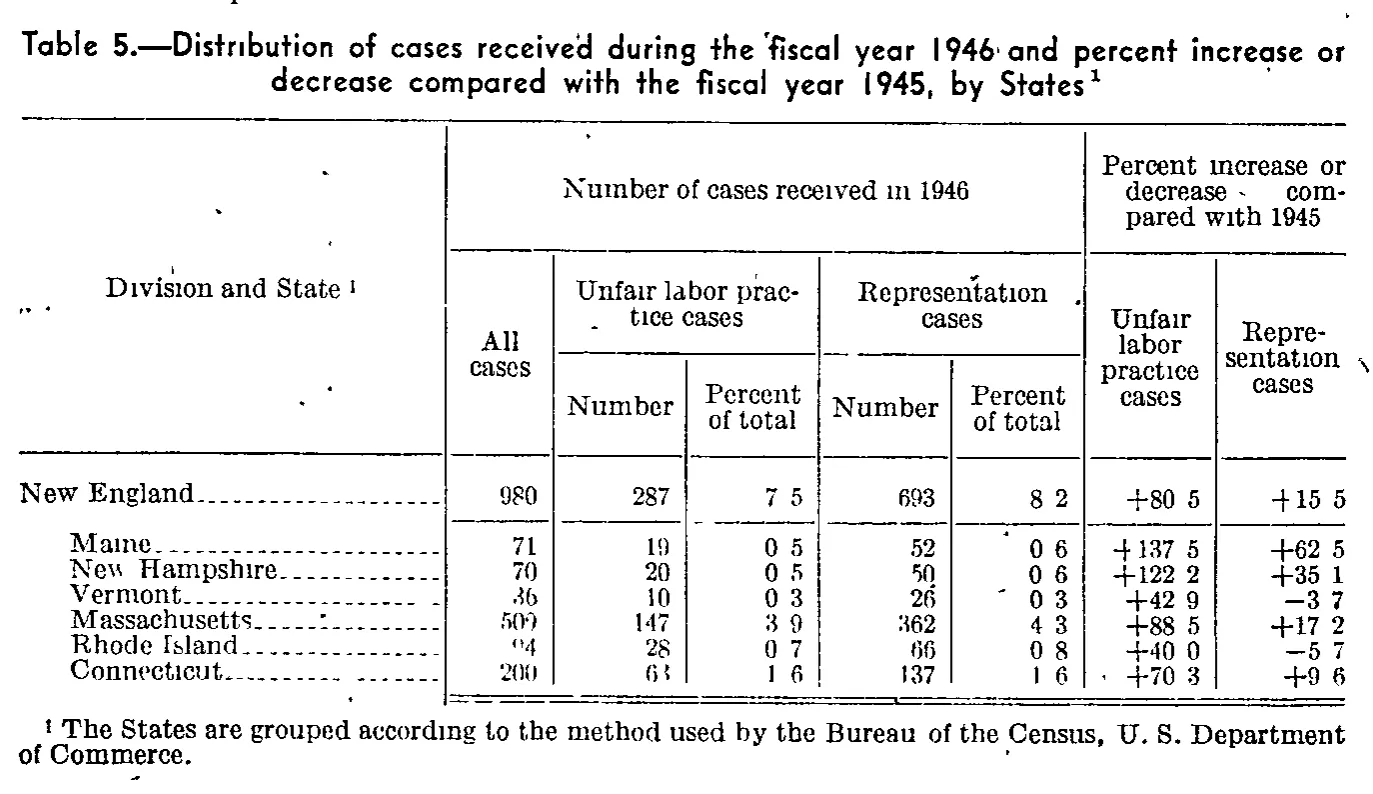
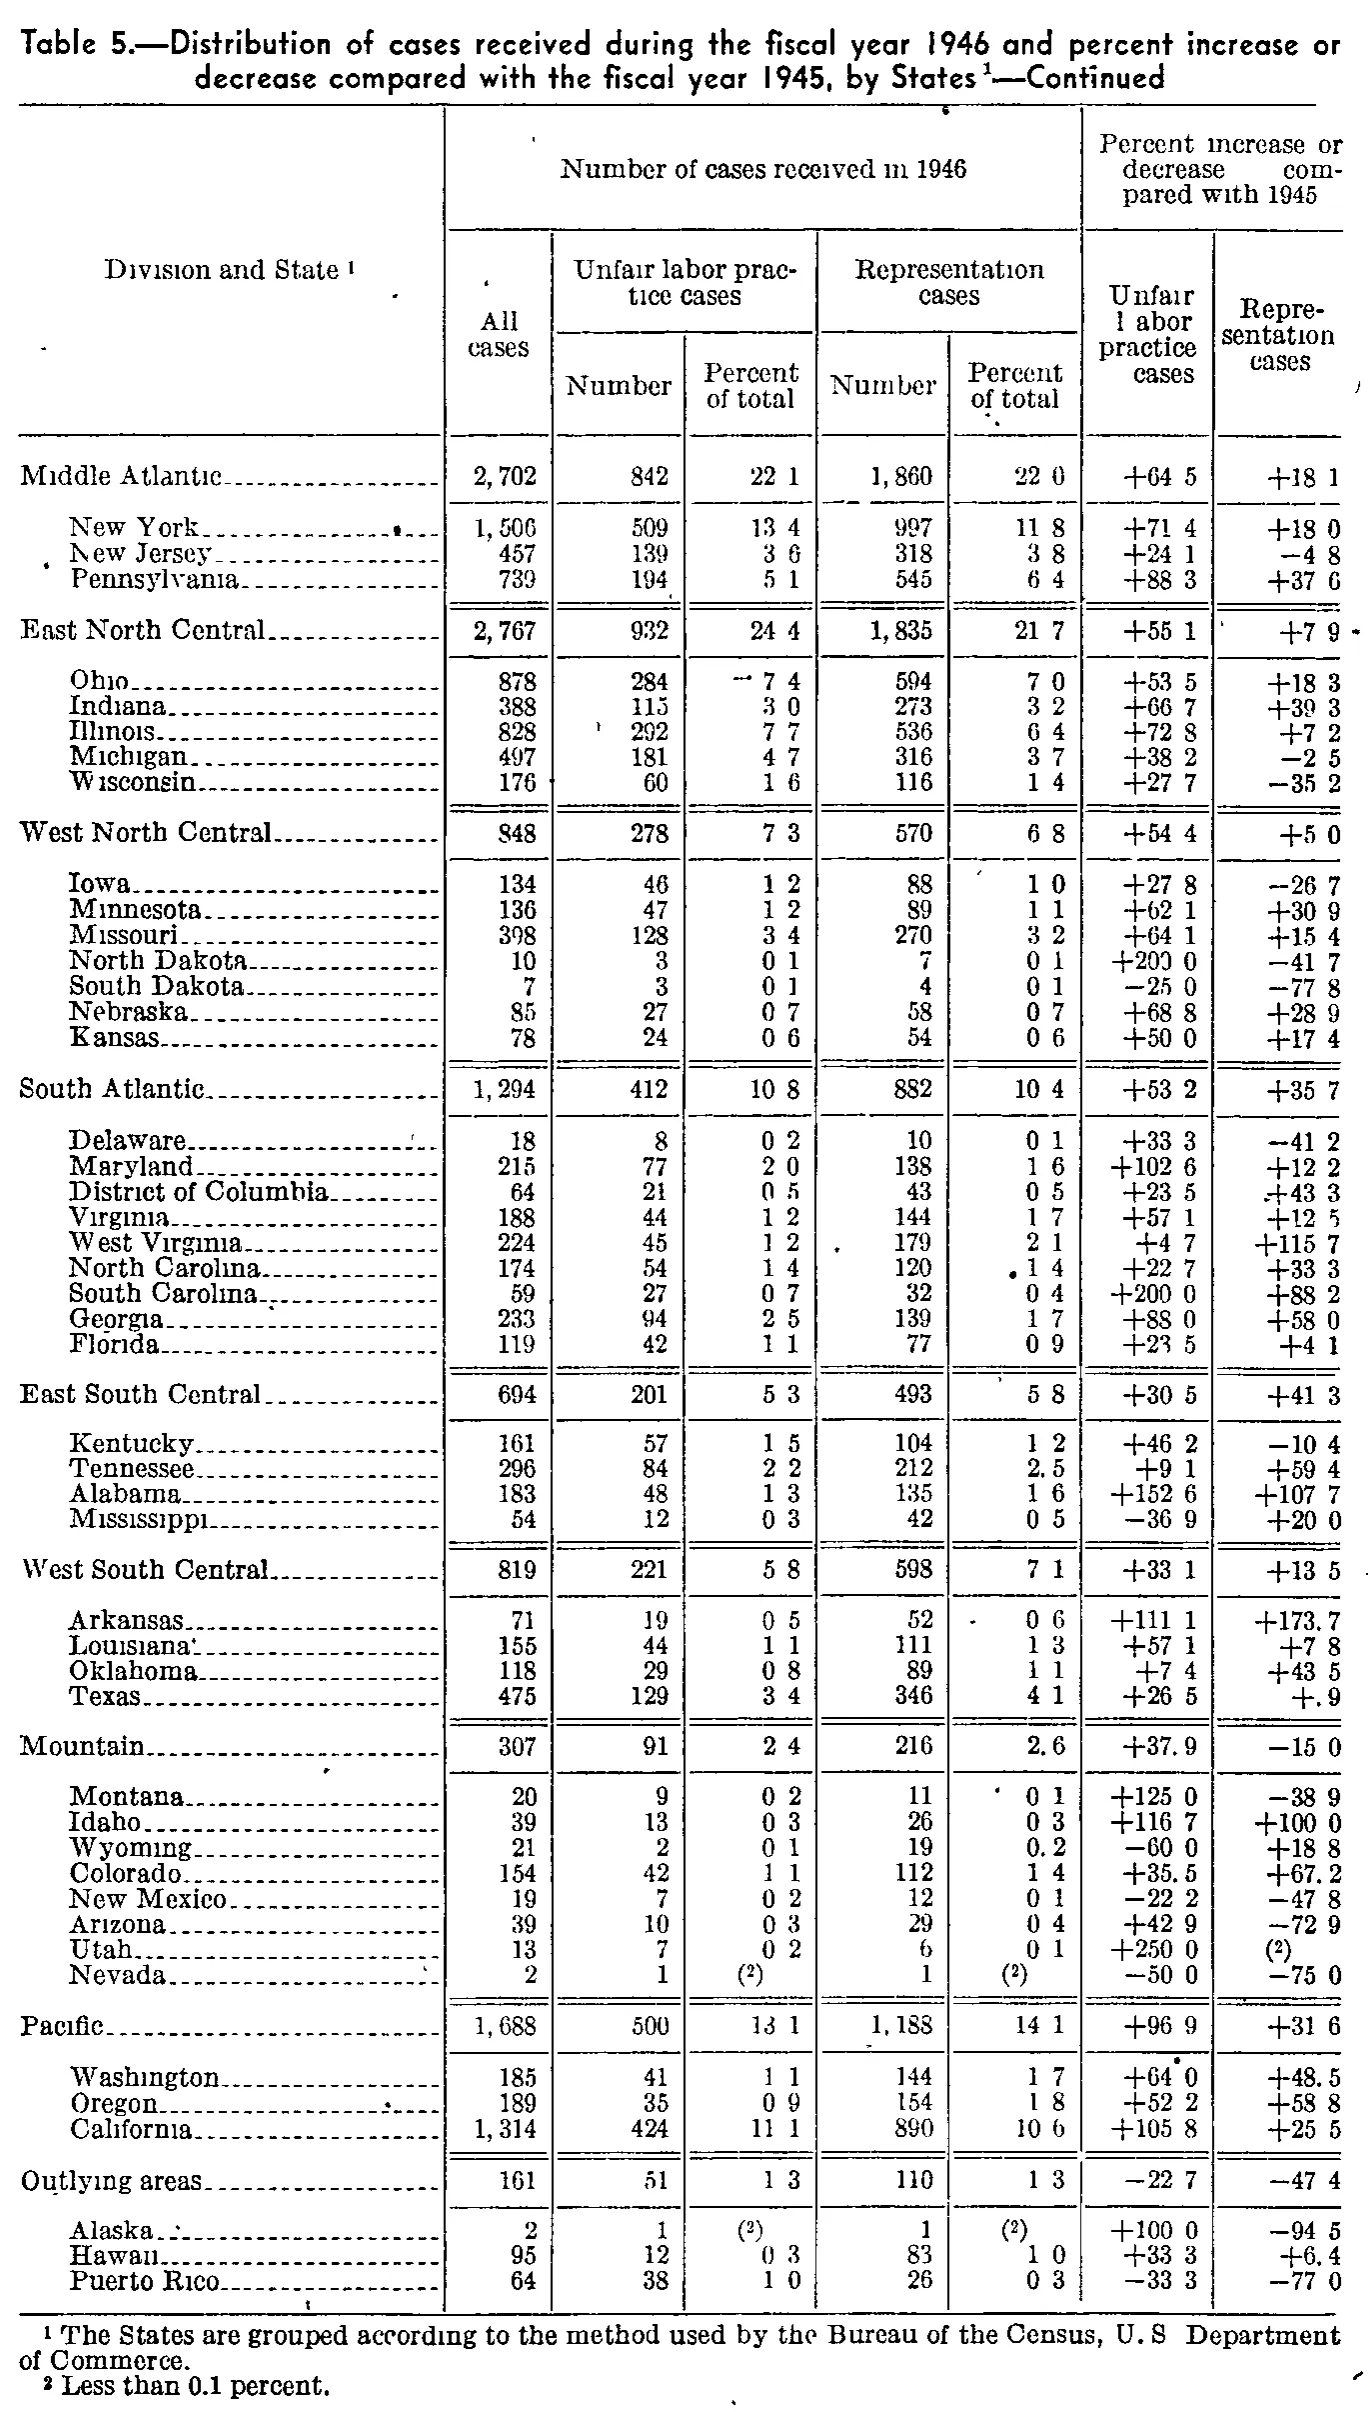
Distribution of cases received during the fiscal year 1946 and percent increase or decrease compared with the fiscal year 1945, by States
Stitched from pp. 111–112.
| Division and State | Number of cases received in 1946 | Percent increase or decrease compared with 1945 | |||||
|---|---|---|---|---|---|---|---|
| Division and State | All cases | Unfair labor practice cases | Representation cases | Unfair labor practice cases | Representation cases | ||
| Division and State | All cases | Number | Percent of total | Number | Percent of total | Unfair labor practice cases | Representation cases |
| New England | 980 | 287 | 7.5 | 693 | 8.2 | +80.5 | +15.5 |
| Maine | 71 | 19 | 0.5 | 52 | 0.6 | +137.5 | +62.5 |
| New Hampshire | 70 | 20 | 0.5 | 50 | 0.6 | +122.2 | +35.1 |
| Vermont | 36 | 10 | 0.3 | 26 | 0.3 | +42.9 | -3.7 |
| Massachusetts | 509 | 147 | 3.9 | 362 | 4.3 | +88.5 | +17.2 |
| Rhode Island | 94 | 28 | 0.7 | 66 | 0.8 | +40.0 | -5.7 |
| Connecticut | 200 | 63 | 1.6 | 137 | 1.6 | +70.3 | +9.6 |
| Middle Atlantic | 2,702 | 842 | 22.1 | 1,860 | 22.0 | +64.5 | +18.1 |
| New York | 1,506 | 509 | 13.4 | 997 | 11.8 | +71.4 | +18.0 |
| New Jersey | 457 | 139 | 3.6 | 318 | 3.8 | +24.1 | -4.8 |
| Pennsylvania | 739 | 194 | 5.1 | 545 | 6.4 | +88.3 | +37.6 |
| East North Central | 2,767 | 932 | 24.4 | 1,835 | 21.7 | +55.1 | +7.9 |
| Ohio | 878 | 284 | 7.4 | 594 | 7.0 | +53.5 | +18.3 |
| Indiana | 388 | 115 | 3.0 | 273 | 3.2 | +66.7 | +39.3 |
| Illinois | 828 | 292 | 7.7 | 536 | 6.4 | +72.8 | +7.2 |
| Michigan | 497 | 181 | 4.7 | 316 | 3.7 | +38.2 | -2.5 |
| Wisconsin | 176 | 60 | 1.6 | 116 | 1.4 | +27.7 | -35.2 |
| West North Central | 848 | 278 | 7.3 | 570 | 6.8 | +54.4 | +5.0 |
| Iowa | 134 | 46 | 1.2 | 88 | 1.0 | +27.8 | -26.7 |
| Minnesota | 136 | 47 | 1.2 | 89 | 1.1 | +62.1 | +30.9 |
| Missouri | 398 | 128 | 3.4 | 270 | 3.2 | +64.1 | +15.4 |
| North Dakota | 10 | 3 | 0.1 | 7 | 0.1 | +200.0 | -41.7 |
| South Dakota | 7 | 3 | 0.1 | 4 | 0.1 | -25.0 | -77.8 |
| Nebraska | 85 | 27 | 0.7 | 58 | 0.7 | +68.8 | +28.9 |
| Kansas | 78 | 24 | 0.6 | 54 | 0.6 | +50.0 | +17.4 |
| South Atlantic | 1,294 | 412 | 10.8 | 882 | 10.4 | +53.2 | +35.7 |
| Delaware | 18 | 8 | 0.2 | 10 | 0.1 | +33.3 | -41.2 |
| Maryland | 215 | 77 | 2.0 | 138 | 1.6 | +102.6 | +12.2 |
| District of Columbia | 64 | 21 | 0.5 | 43 | 0.5 | +23.5 | +43.3 |
| Virginia | 188 | 44 | 1.2 | 144 | 1.7 | +57.1 | +12.5 |
| West Virginia | 224 | 45 | 1.2 | 179 | 2.1 | +4.7 | +115.7 |
| North Carolina | 174 | 54 | 1.4 | 120 | 1.4 | +22.7 | +33.3 |
| South Carolina | 59 | 27 | 0.7 | 32 | 0.4 | +200.0 | -88.2 |
| Georgia | 233 | 94 | 2.5 | 139 | 1.7 | +88.0 | +58.0 |
| Florida | 119 | 42 | 1.1 | 77 | 0.9 | +23.5 | +4.1 |
| East South Central | 694 | 201 | 5.3 | 493 | 5.8 | +30.5 | +41.3 |
| Kentucky | 161 | 57 | 1.5 | 104 | 1.2 | +46.2 | -10.4 |
| Tennessee | 296 | 84 | 2.2 | 212 | 2.5 | +9.1 | +59.4 |
| Alabama | 183 | 48 | 1.3 | 135 | 1.6 | +152.6 | +107.7 |
| Mississippi | 54 | 12 | 0.3 | 42 | 0.5 | -36.9 | +20.0 |
| West South Central | 819 | 221 | 5.8 | 598 | 7.1 | +33.1 | +13.5 |
| Arkansas | 71 | 19 | 0.5 | 52 | 0.6 | +111.1 | +173.7 |
| Louisiana | 155 | 44 | 1.1 | 111 | 1.3 | +57.1 | +7.8 |
| Oklahoma | 118 | 29 | 0.8 | 89 | 1.1 | +7.4 | +43.5 |
| Texas | 475 | 129 | 3.4 | 346 | 4.1 | +26.5 | +.9 |
| Mountain | 307 | 91 | 2.4 | 216 | 2.6 | +37.9 | -15.0 |
| Montana | 20 | 9 | 0.2 | 11 | 0.1 | +125.0 | -38.9 |
| Idaho | 39 | 13 | 0.3 | 26 | 0.3 | +116.7 | +100.0 |
| Wyoming | 21 | 2 | 0.1 | 19 | 0.2 | -60.0 | +18.8 |
| Colorado | 154 | 42 | 1.1 | 112 | 1.4 | +35.5 | +67.2 |
| New Mexico | 19 | 7 | 0.2 | 12 | 0.1 | -22.2 | -47.8 |
| Arizona | 39 | 10 | 0.3 | 29 | 0.4 | +42.9 | -72.9 |
| Utah | 13 | 7 | 0.2 | 6 | 0.1 | +250.0 | |
| Nevada | 2 | 1 | 1 | -50.0 | -75.0 | ||
| Pacific | 1,688 | 500 | 13.1 | 1,188 | 14.1 | +96.9 | +31.6 |
| Washington | 185 | 41 | 1.1 | 144 | 1.7 | +64.0 | +48.5 |
| Oregon | 189 | 35 | 0.9 | 154 | 1.8 | +52.2 | +58.8 |
| California | 1,314 | 424 | 11.1 | 890 | 10.6 | +105.8 | +25.5 |
| Outlying areas | 161 | 51 | 1.3 | 110 | 1.3 | -22.7 | -47.4 |
| Alaska | 2 | 1 | 1 | +100.0 | -94.5 | ||
| Hawaii | 95 | 12 | 0.3 | 83 | 1.0 | +33.3 | +6.4 |
| Puerto Rico | 64 | 38 | 1.0 | 26 | 0.3 | -33.3 | -77.0 |
- 1 The States are grouped according to the method used by the Bureau of the Census, U. S. Department of Commerce.
- 2 Less than 0.1 percent.
186 of 186 figures sit in a row or column sum that works out.
Reader’s notes
p. 111. Crop coverage: this is the top of Table 5; only the caption, the column headings, and the New England division (division line plus its six States) are shown. The table continues with the remaining census divisions on following pages, and the body is cut off immediately below the Connecticut line (a double rule is visible, which is the crop boundary rather than a printed table end). Decimal points: the scan is a low-quality bitonal image in which the decimal points have dropped out, so the percentage columns print as e.g. "7 5", "0 5", "+137 5", "-3 7". These are decimal fractions in the original typesetting and I have transcribed them with the decimal point restored ("7.5", "0.5", "+137.5", "-3.7"). No digits were inferred — only the missing points. If you need the literal pixel content, every such cell had a blank where the point belongs. Doubtful cells: "Rhode Island" / "All cases" is badly degraded and reads like "04" or "(14"; I transcribed it as 94 because the row's two components (28 unfair labor practice + 66 representation) sum to 94, matching the pattern of every other row. "Vermont" / "All cases" (36), "Massachusetts" / "All cases" (509) and "Connecticut" / "All cases" (200) are also somewhat broken but legible. Internal consistency: in every one of the seven rows the unfair labor practice Number plus the representation Number equals the All cases figure (287+693=980; 19+52=71; 20+50=70; 10+26=36; 147+362=509; 28+66=94; 63+137=200), so no printed total appears to be in error. The footnote marker 1 is attached to the stub heading "Division and State" and also to the caption (the caption is omitted per instructions).
p. 112. Decimal points: this is a 1-bit scan in which the thin period of a one-decimal figure frequently drops out, so most percent cells print as e.g. "22 1", "+64 5", "0 1". A minority of cells on the same page retain a visible period ("2.5" at Tennessee/representation percent, "2.6" at Mountain/representation percent, "0.2" at Wyoming/representation percent, "+37.9", "+35.5", "+67.2", "+173.7", "+64.0", "+48.5", "+52.2", "+58.8", "+105.8", "+25.5", "+6.4", "-94.5", "+.9"), confirming that every such gap is a dropped decimal point. All percent columns are therefore transcribed with the decimal point restored. Texas / representation percent increase is printed as "+.9" with no leading zero and is transcribed that way. Footnote-reference cells: Utah / representation percent increase, and both percent-of-total cells for Nevada and for Alaska, contain nothing but the parenthesised raised "2" reference (footnote 2, "Less than 0.1 percent"). They are transcribed as "(^2)" — printed parentheses retained, raised digit marked with a caret. Crop coverage: this is a "—Continued" page; the table begins on the preceding page, so the United States total and the New England division (and any divisions before Middle Atlantic) are not on this image. The body here runs from Middle Atlantic through Puerto Rico, and no total row appears on this crop. Doubtful cells: Ohio / unfair labor practice percent of total has a stray dash-like speck immediately left of the figure; I read the value as 7.4 and treat the mark as scan debris, not a minus sign or footnote marker. District of Columbia / representation percent increase has a smudged sign that I read as "+43.3". Mississippi / unfair labor practice percent increase reads "-36.9"; the final digit is slightly broken. In footnote 1 the period after "U. S" is not visible in the scan (rendered here as "U. S."). Stray ink specks sit in several margins (e.g. beside New York, Illinois, Iowa, North Carolina, Arkansas, Montana, Washington) and are not transcribed.
Source image
Source data: U.S. NLRB Annual Reports (public domain). Reconstruction by NLRB Stats Archive. Read by claude-opus-5 (effort max, prompt extract_v1) from the 300-dpi scan; stitched by page. Updated October 2026.