NLRB Stats Archive › Annual Reports › FY1946 › Cases and workers involved in cases received
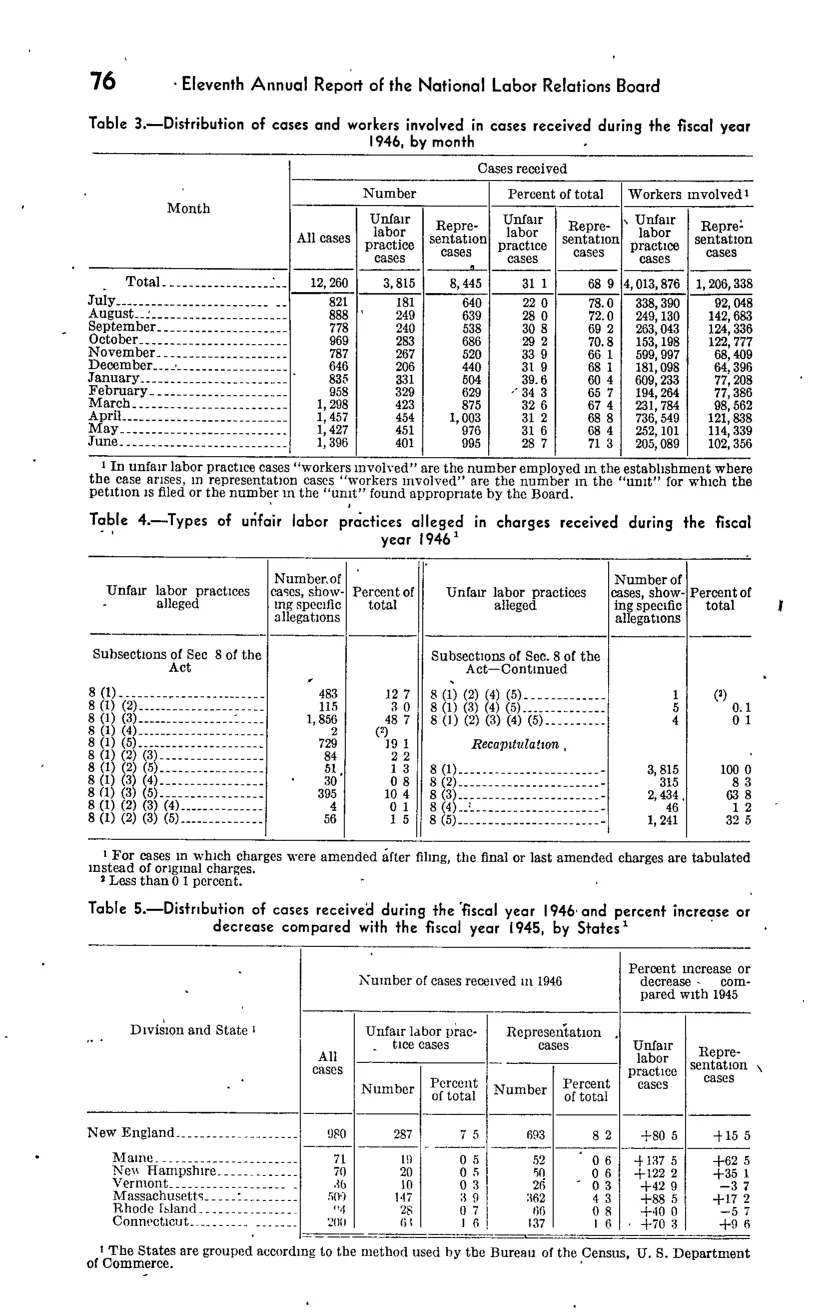
Cases and workers involved in cases received
| Month | Cases received | Cases received | Cases received | Cases received | Cases received | Cases received | Cases received |
|---|---|---|---|---|---|---|---|
| Month | Number | Number | Number | Percent of total | Percent of total | Workers involved | Workers involved |
| Month | All cases | Unfair labor practice cases | Representation cases | Unfair labor practice cases | Representation cases | Unfair labor practice cases | Representation cases |
| Total | 12,260 | 3,815 | 8,445 | 31.1 | 68.9 | 4,013,876 | 1,206,338 |
| July | 821 | 181 | 640 | 22 | 78 | 338,390 | 92,048 |
| August | 888 | 249 | 639 | 28 | 72 | 249,130 | 142,683 |
| September | 738 | 200 | 538 | 27.1 | 72.9 | 263,043 | 124,836 |
| October | 969 | 280 | 689 | 28.9 | 71.1 | 153,198 | 122,777 |
| November | 787 | 267 | 520 | 33.9 | 66.1 | 590,997 | 68,409 |
| December | 646 | 206 | 440 | 31.9 | 68.1 | 181,098 | 64,396 |
| January | 835 | 331 | 504 | 39.6 | 60.4 | 609,233 | 77,866 |
| February | 935 | 329 | 606 | 34.3 | 65.7 | 194,284 | 77,366 |
| March | 1,298 | 423 | 875 | 32.6 | 67.4 | 231,784 | 96,562 |
| April | 1,457 | 454 | 1,003 | 31.2 | 68.8 | 584,569 | 121,838 |
| May | 1,427 | 451 | 976 | 31.6 | 68.4 | 252,101 | 114,339 |
| June | 1,396 | 401 | 995 | 28.7 | 71.3 | 205,089 | 102,356 |
Source image
Source data: U.S. NLRB Annual Reports (public domain). Reconstruction by NLRB Stats Archive. Updated June 2026.