NLRB Stats Archive › Annual Reports › FY1945 › Number of elections and cross-checks and number of valid votes cast during the fiscal year 1945, by industry
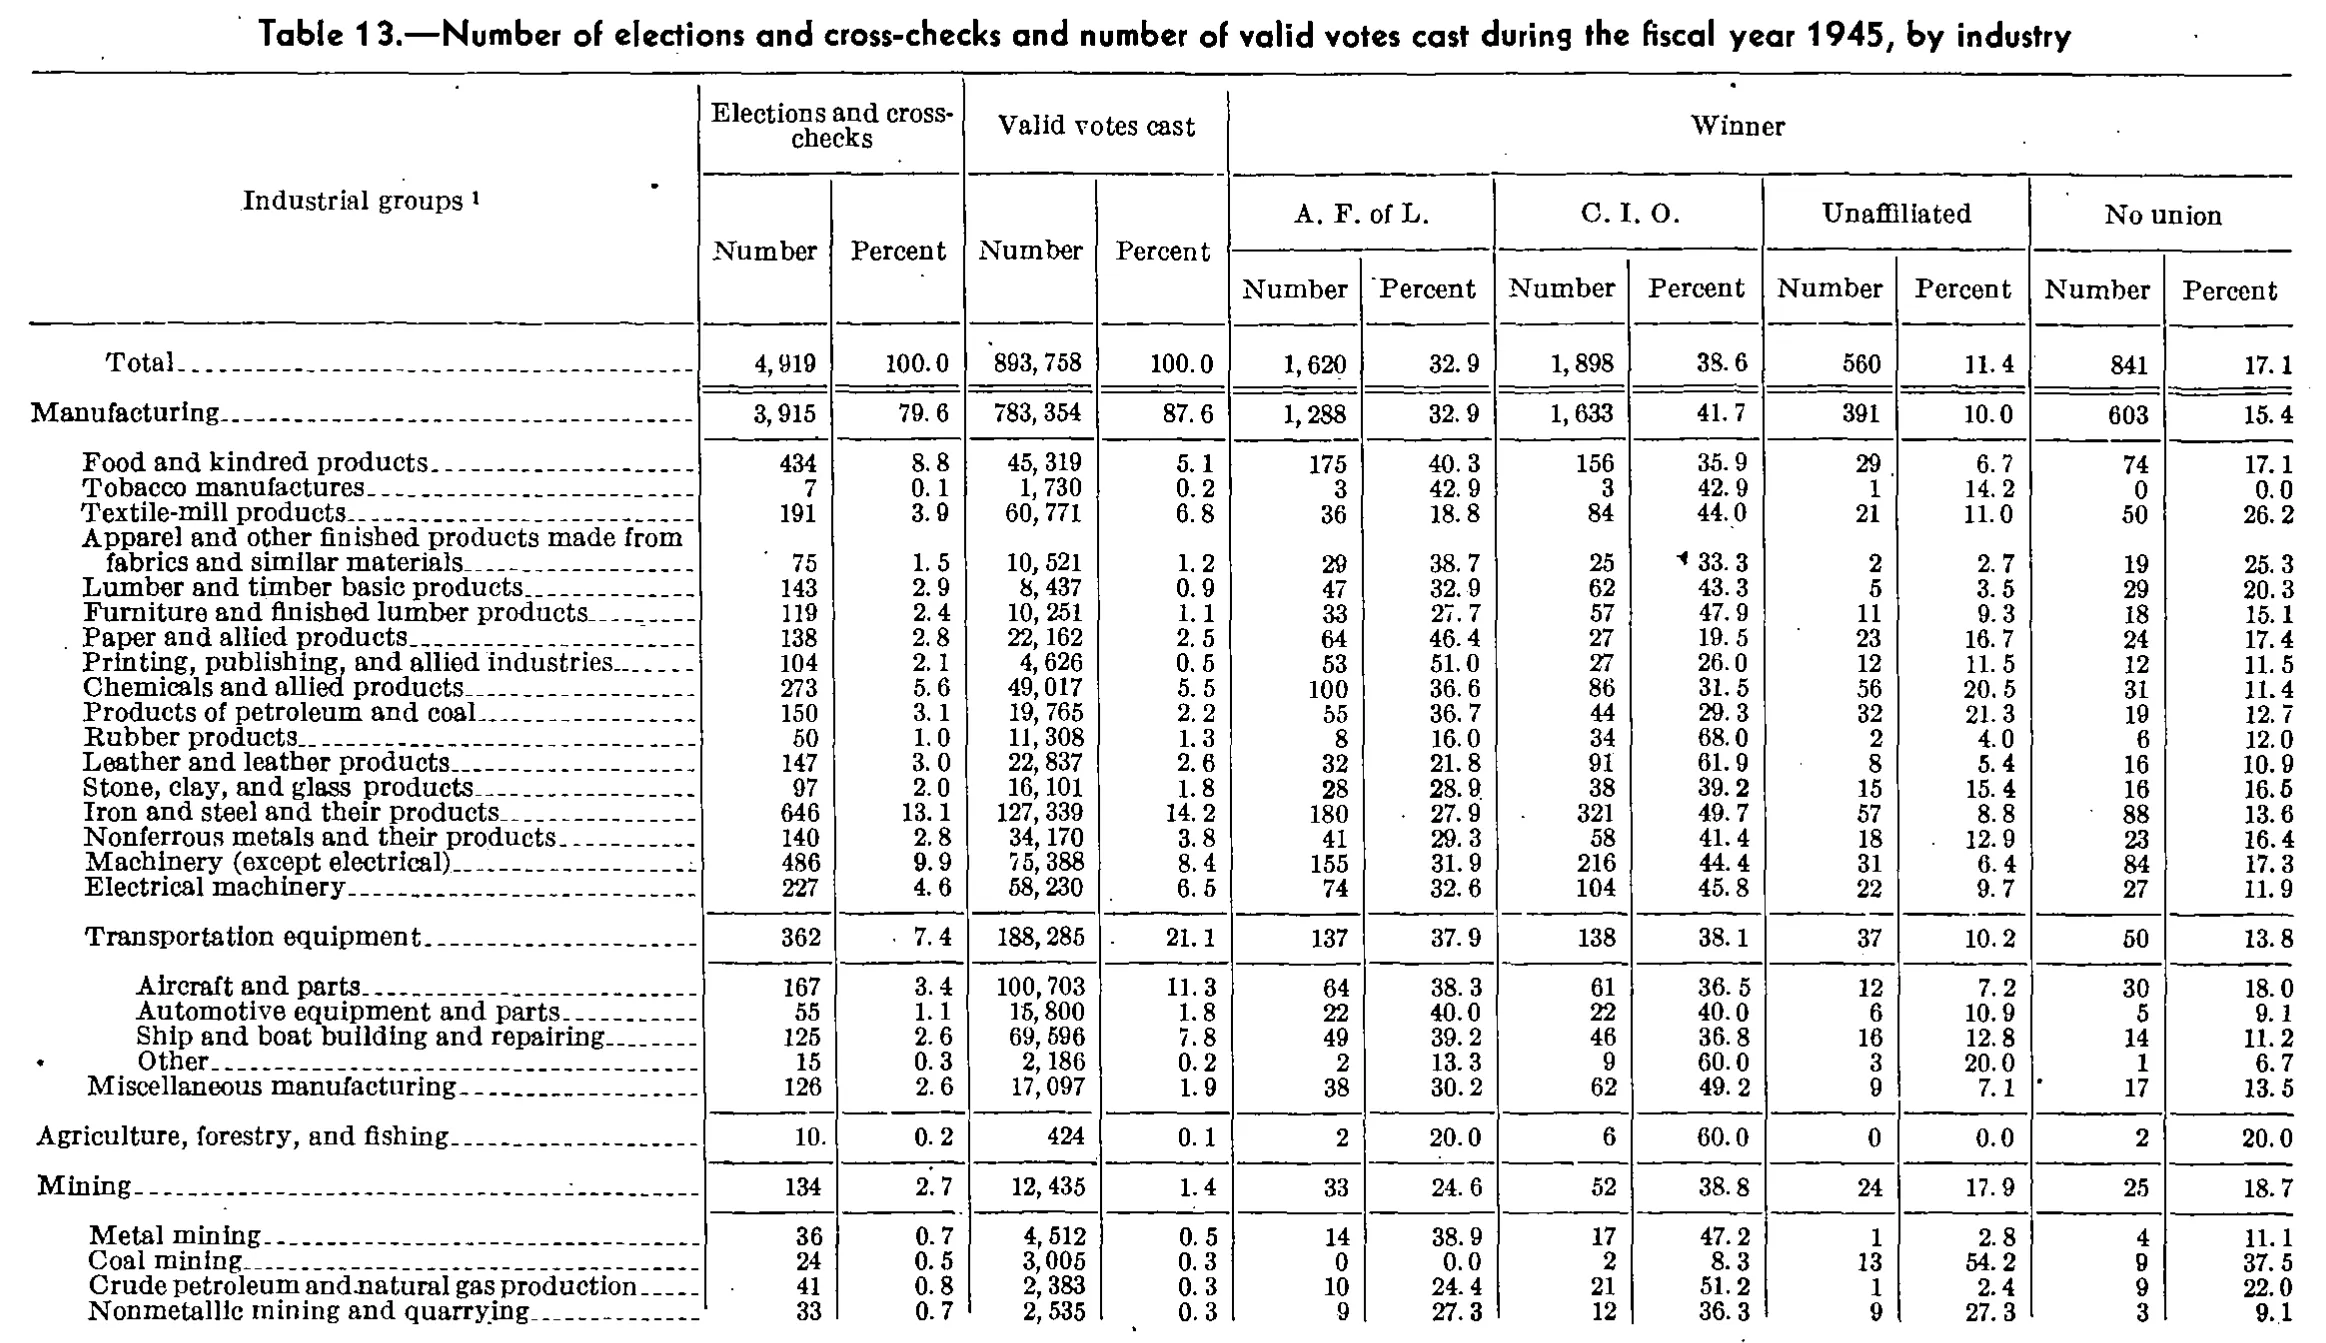
Number of elections and cross-checks and number of valid votes cast during the fiscal year 1945, by industry
Stitched from pp. 95–96.
| Industrial groups | Elections and cross-checks | Valid votes cast | Winner | |||||||||
|---|---|---|---|---|---|---|---|---|---|---|---|---|
| Industrial groups | Number | Percent | Number | Percent | A. F. of L. | C. I. O. | Unaffiliated | No union | ||||
| Industrial groups | Number | Percent | Number | Percent | Number | Percent | Number | Percent | Number | Percent | Number | Percent |
| Total | 4,919 | 100.0 | 893,758 | 100.0 | 1,620 | 32.9 | 1,898 | 38.6 | 560 | 11.4 | 841 | 17.1 |
| Manufacturing | 3,915 | 79.6 | 783,354 | 87.6 | 1,288 | 32.9 | 1,633 | 41.7 | 391 | 10.0 | 603 | 15.4 |
| Food and kindred products | 434 | 8.8 | 45,319 | 5.1 | 175 | 40.3 | 156 | 35.9 | 29 | 6.7 | 74 | 17.1 |
| Tobacco manufactures | 7 | 0.1 | 1,730 | 0.2 | 3 | 42.9 | 3 | 42.9 | 1 | 14.2 | 0 | 0.0 |
| Textile-mill products | 191 | 3.9 | 60,771 | 6.8 | 36 | 18.8 | 84 | 44.0 | 21 | 11.0 | 50 | 26.2 |
| Apparel and other finished products made from fabrics and similar materials | 75 | 1.5 | 10,521 | 1.2 | 29 | 38.7 | 25 | 33.3 | 2 | 2.7 | 19 | 25.3 |
| Lumber and timber basic products | 143 | 2.9 | 8,437 | 0.9 | 47 | 32.9 | 62 | 43.3 | 5 | 3.5 | 29 | 20.3 |
| Furniture and finished lumber products | 119 | 2.4 | 10,251 | 1.1 | 33 | 27.7 | 57 | 47.9 | 11 | 9.3 | 18 | 15.1 |
| Paper and allied products | 138 | 2.8 | 22,162 | 2.5 | 64 | 46.4 | 27 | 19.5 | 23 | 16.7 | 24 | 17.4 |
| Printing, publishing, and allied industries | 104 | 2.1 | 4,626 | 0.5 | 53 | 51.0 | 27 | 26.0 | 12 | 11.5 | 12 | 11.5 |
| Chemicals and allied products | 273 | 5.6 | 49,017 | 5.5 | 100 | 36.6 | 86 | 31.5 | 56 | 20.5 | 31 | 11.4 |
| Products of petroleum and coal | 150 | 3.1 | 19,765 | 2.2 | 55 | 36.7 | 44 | 29.3 | 32 | 21.3 | 19 | 12.7 |
| Rubber products | 50 | 1.0 | 11,308 | 1.3 | 8 | 16.0 | 34 | 68.0 | 2 | 4.0 | 6 | 12.0 |
| Leather and leather products | 147 | 3.0 | 22,837 | 2.6 | 32 | 21.8 | 91 | 61.9 | 8 | 5.4 | 16 | 10.9 |
| Stone, clay, and glass products | 97 | 2.0 | 16,101 | 1.8 | 28 | 28.9 | 38 | 39.2 | 15 | 15.4 | 16 | 16.5 |
| Iron and steel and their products | 646 | 13.1 | 127,339 | 14.2 | 180 | 27.9 | 321 | 49.7 | 57 | 8.8 | 88 | 13.6 |
| Nonferrous metals and their products | 140 | 2.8 | 34,170 | 3.8 | 41 | 29.3 | 58 | 41.4 | 18 | 12.9 | 23 | 16.4 |
| Machinery (except electrical) | 486 | 9.9 | 75,388 | 8.4 | 155 | 31.9 | 216 | 44.4 | 31 | 6.4 | 84 | 17.3 |
| Electrical machinery | 227 | 4.6 | 58,230 | 6.5 | 74 | 32.6 | 104 | 45.8 | 22 | 9.7 | 27 | 11.9 |
| Transportation equipment | 362 | 7.4 | 188,285 | 21.1 | 137 | 37.9 | 138 | 38.1 | 37 | 10.2 | 50 | 13.8 |
| Aircraft and parts | 167 | 3.4 | 100,703 | 11.3 | 64 | 38.3 | 61 | 36.5 | 12 | 7.2 | 30 | 18.0 |
| Automotive equipment and parts | 55 | 1.1 | 15,800 | 1.8 | 22 | 40.0 | 22 | 40.0 | 6 | 10.9 | 5 | 9.1 |
| Ship and boat building and repairing | 125 | 2.6 | 69,596 | 7.8 | 49 | 39.2 | 46 | 36.8 | 16 | 12.8 | 14 | 11.2 |
| Other | 15 | 0.3 | 2,186 | 0.2 | 2 | 13.3 | 9 | 60.0 | 3 | 20.0 | 1 | 6.7 |
| Miscellaneous manufacturing | 126 | 2.6 | 17,097 | 1.9 | 38 | 30.2 | 62 | 49.2 | 9 | 7.1 | 17 | 13.5 |
| Agriculture, forestry, and fishing | 10 | 0.2 | 424 | 0.1 | 2 | 20.0 | 6 | 60.0 | 0 | 0.0 | 2 | 20.0 |
| Mining | 134 | 2.7 | 12,435 | 1.4 | 33 | 24.6 | 52 | 38.8 | 24 | 17.9 | 25 | 18.7 |
| Metal mining | 36 | 0.7 | 4,512 | 0.5 | 14 | 38.9 | 17 | 47.2 | 1 | 2.8 | 4 | 11.1 |
| Coal mining | 24 | 0.5 | 3,005 | 0.3 | 0 | 0.0 | 2 | 8.3 | 13 | 54.2 | 9 | 37.5 |
| Crude petroleum and natural gas production | 41 | 0.8 | 2,383 | 0.3 | 10 | 24.4 | 21 | 51.2 | 1 | 2.4 | 9 | 22.0 |
| Nonmetallic mining and quarrying | 33 | 0.7 | 2,535 | 0.3 | 9 | 27.3 | 12 | 36.3 | 9 | 27.3 | 3 | 9.1 |
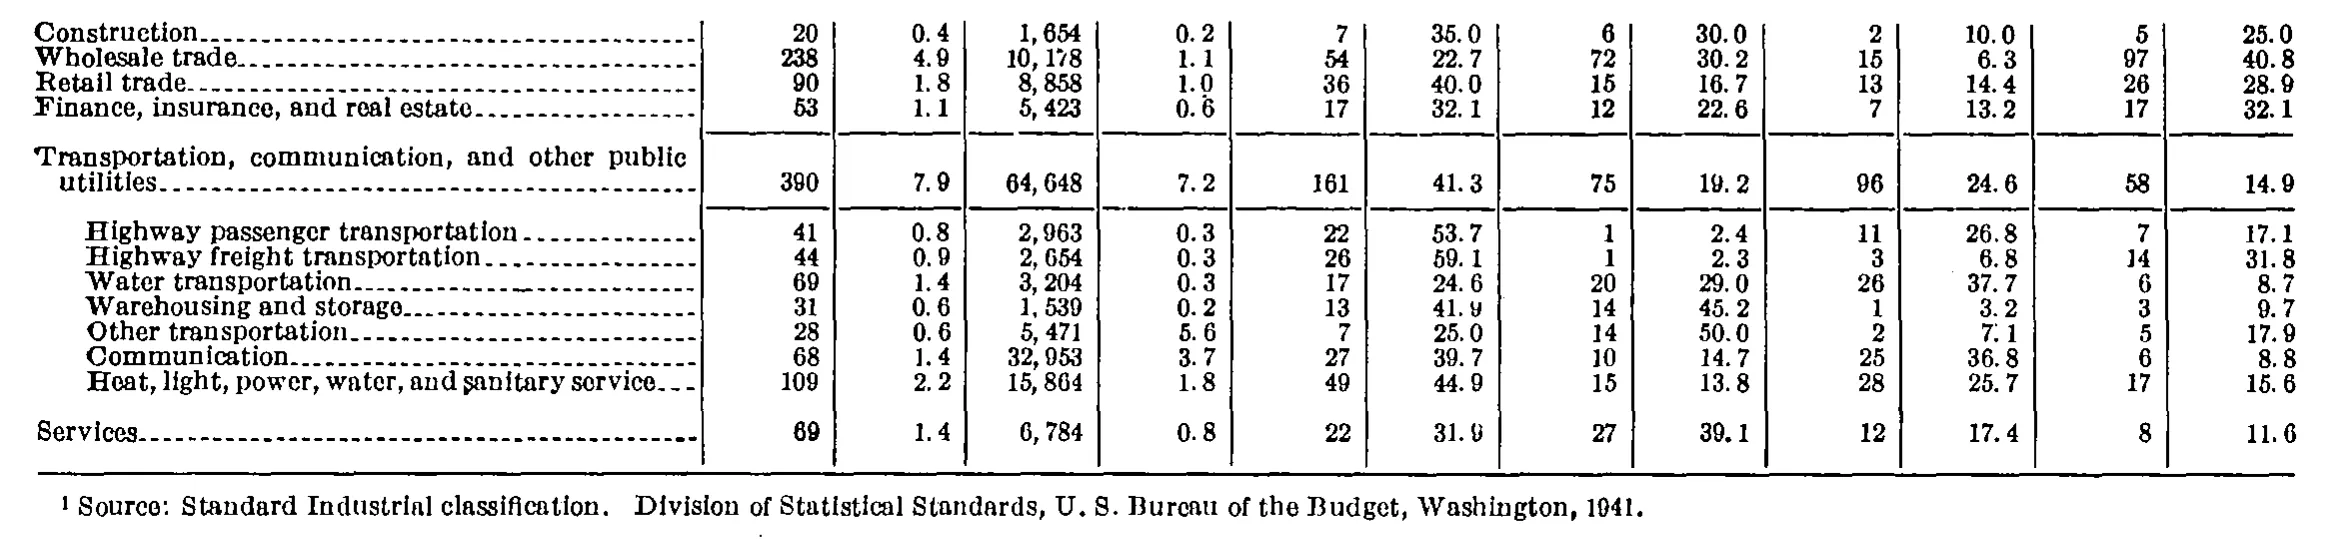
| Construction | 20 | 0.4 | 1,654 | 0.2 | 7 | 35.0 | 6 | 30.0 | 2 | 10.0 | 5 | 25.0 |
| Wholesale trade | 238 | 4.9 | 10,178 | 1.1 | 54 | 22.7 | 72 | 30.2 | 15 | 6.3 | 97 | 40.8 |
| Retail trade | 90 | 1.8 | 8,858 | 1.0 | 36 | 40.0 | 15 | 16.7 | 13 | 14.4 | 26 | 28.9 |
| Finance, insurance, and real estate | 53 | 1.1 | 5,423 | 0.6 | 17 | 32.1 | 12 | 22.6 | 7 | 13.2 | 17 | 32.1 |
| Transportation, communication, and other public utilities | 390 | 7.9 | 64,648 | 7.2 | 161 | 41.3 | 75 | 19.2 | 96 | 24.6 | 58 | 14.9 |
| Highway passenger transportation | 41 | 0.8 | 2,963 | 0.3 | 22 | 53.7 | 1 | 2.4 | 11 | 26.8 | 7 | 17.1 |
| Highway freight transportation | 44 | 0.9 | 2,654 | 0.3 | 26 | 59.1 | 1 | 2.3 | 3 | 6.8 | 14 | 31.8 |
| Water transportation | 69 | 1.4 | 3,204 | 0.3 | 17 | 24.6 | 20 | 29.0 | 26 | 37.7 | 6 | 8.7 |
| Warehousing and storage | 31 | 0.6 | 1,539 | 0.2 | 13 | 41.9 | 14 | 45.2 | 1 | 3.2 | 3 | 9.7 |
| Other transportation | 28 | 0.6 | 5,471 | 5.6 | 7 | 25.0 | 14 | 50.0 | 2 | 7.1 | 5 | 17.9 |
| Communication | 68 | 1.4 | 32,953 | 3.7 | 27 | 39.7 | 10 | 14.7 | 25 | 36.8 | 6 | 8.8 |
| Heat, light, power, water, and sanitary service | 109 | 2.2 | 15,864 | 1.8 | 49 | 44.9 | 15 | 13.8 | 28 | 25.7 | 17 | 15.6 |
| Services | 69 | 1.4 | 6,784 | 0.8 | 22 | 31.9 | 27 | 39.1 | 12 | 17.4 | 8 | 11.6 |
- 1 Source: Standard Industrial classification. Division of Statistical Standards, U. S. Bureau of the Budget, Washington, 1941.
261 of 261 figures sit in a row or column sum that works out.
Reader’s notes
p. 95. 13 columns: stub plus Number/Percent under "Elections and cross-checks" and "Valid votes cast", then Number/Percent under each of the four "Winner" sub-headings (A. F. of L., C. I. O., Unaffiliated, No union). The crop is cut off at the bottom: the table continues past "Nonmetallic mining and quarrying" (the remaining industry groups are not on this image), and no footnote text is visible, so `footnotes` is empty even though the stub heading carries a raised "1" marker. Cell-level remarks: - "Agriculture, forestry, and fishing", Elections and cross-checks / Number: printed as "10." with a trailing dot. I read the dot as a stray leader-dot/ink mark and transcribed "10"; the four Winner Number cells on that row (2+6+0+2) sum to 10, supporting this. - "Apparel and other finished products made from fabrics and similar materials", C. I. O. / Percent: a small stray wedge-shaped ink mark sits immediately left of "33.3". It does not look like a footnote marker (no other row has one) and I treated it as a printing artifact, not part of the value. - "Tobacco manufactures", Unaffiliated / Percent: printed 14.2; 1 of 7 would round to 14.3, so this looks like a printed rounding error or misprint. Transcribed as printed. - "Nonmetallic mining and quarrying", C. I. O. / Percent: printed 36.3; 12 of 33 would round to 36.4. Transcribed as printed. Arithmetic cross-check (not applied to any cell, verification only): for every one of the 31 rows the four Winner "Number" cells sum exactly to the "Elections and cross-checks / Number" cell, including the Total (1,620+1,898+560+841 = 4,919) and Manufacturing (1,288+1,633+391+603 = 3,915) rows. This independently confirms the column assignment of all count columns. "Transportation equipment" is a subtotal line within Manufacturing (set off by rules, same indent as the other manufacturing groups) with its own four indented sub-rows; it is transcribed as a normal data row since it carries values.
p. 96. This crop is a continuation page: no column headings are printed on it, so header_rows is empty. The table has 13 columns (stub plus 12 numeric columns, apparently six count/percent pairs); the crop begins mid-body, so the table's opening rows and its headings are on the preceding page. Doubtful cell: row "Other transportation", column 4 (the percent column that follows the 5,471 figure) is transcribed as 5.6 as printed, but it is almost certainly a misprint for 0.6. Every other row satisfies the table's internal arithmetic, and column 4 of the seven transportation sub-rows sums to the group line's 7.2 only if this cell is 0.6 (0.3+0.3+0.3+0.2+0.6+3.7+1.8 = 7.2); with 5.6 the sum is 12.2. Independently, 5,471 is 0.6 percent of the implied total employment (64,648 = 7.2 percent). The glyph reads as a 5 rather than a 0, so it is left as printed per instruction. Scan-quality notes on digits read as 9: the final digit of 19.2 ("Transportation, communication, and other public utilities", column 8), 41.9 ("Warehousing and storage", column 6) and 31.9 ("Services", column 6) are broken in the scan and could be mistaken for other characters; all three are confirmed as 9 because each row's four percent cells sum to 100.0. Likewise the footnote year prints faintly but is 1941. The row "Transportation, communication, and other public utilities" wraps onto two printed lines with its values aligned to the second line; it is one row. The seven indented rows that follow it are its components (they sum to its totals), and "Services" is at the outer indent level; this crop carries no explicit section-header lines.
Source image
Source data: U.S. NLRB Annual Reports (public domain). Reconstruction by NLRB Stats Archive. Read by claude-opus-5 (effort max, prompt extract_v1) from the 300-dpi scan; stitched by page. Updated October 2026.