NLRB Stats Archive › Annual Reports › FY1945 › Number of elections and cross-checks and valid votes cast
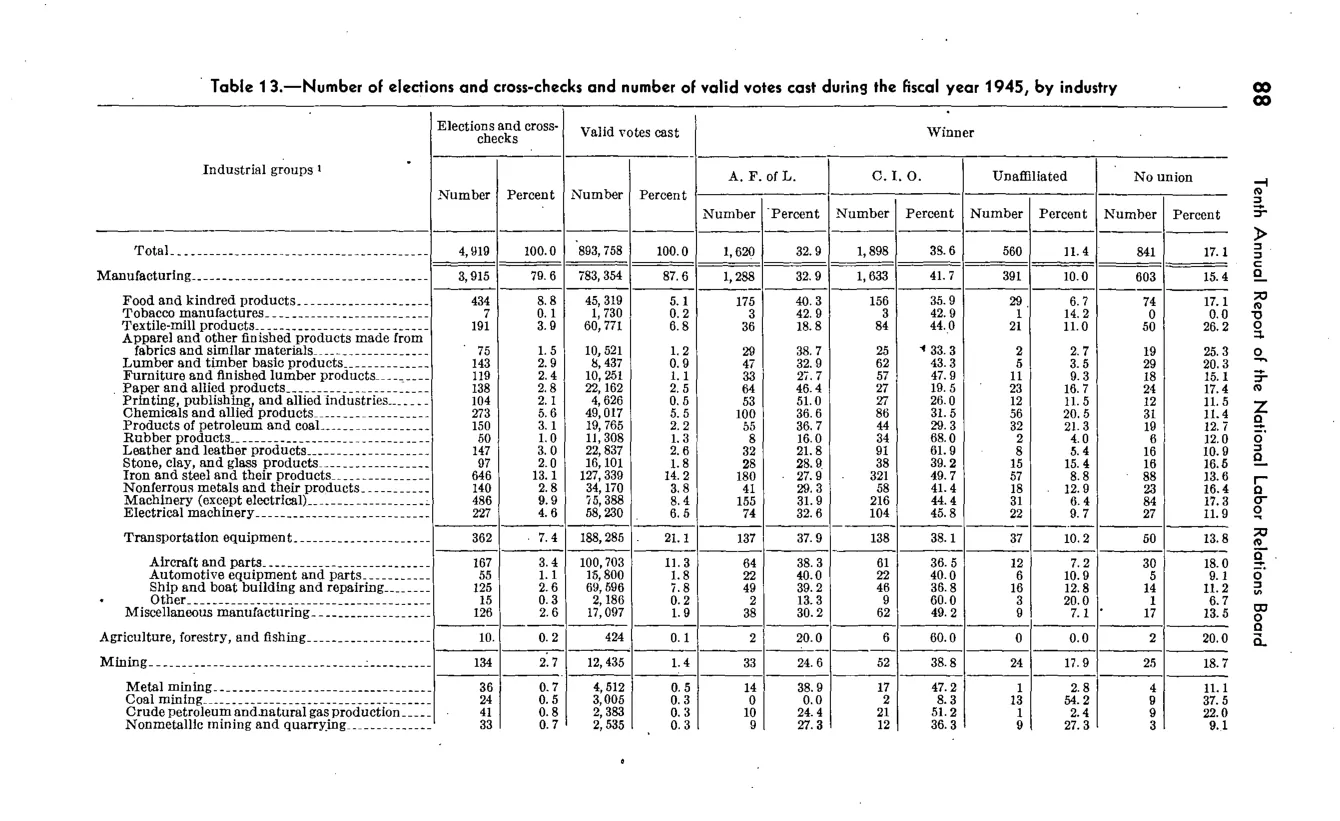
Number of elections and cross-checks and valid votes cast
| Industrial groups | Elections and cross-checks | Elections and cross-checks | Valid votes cast | Valid votes cast | Winner | Winner | Winner | Winner | Winner | Winner | Winner | Winner |
|---|---|---|---|---|---|---|---|---|---|---|---|---|
| Industrial groups | Elections and cross-checks | Elections and cross-checks | Valid votes cast | Valid votes cast | A. F. of L. | A. F. of L. | C. I. O. | C. I. O. | Unaffiliated | Unaffiliated | No union | No union |
| Industrial groups | Number | Percent | Number | Percent | Number | Percent | Number | Percent | Number | Percent | Number | Percent |
| Total | 4,919 | 100 | 893,758 | 100 | 1,620 | 32.9 | 1,898 | 38.6 | 560 | 11.4 | 841 | 17.1 |
| Manufacturing | 3,915 | 79.6 | 783,158 | 87.6 | 1,288 | 32.9 | 1,633 | 41.7 | 391 | 10 | 603 | 15.4 |
| Mining | 154 | 2.7 | 12,435 | 1.4 | 33 | 21.4 | 52 | 33.8 | 24 | 17.9 | 25 | 16.2 |
Source image
Source data: U.S. NLRB Annual Reports (public domain). Reconstruction by NLRB Stats Archive. Updated June 2026.