NLRB Stats Archive › Annual Reports › FY1945 › Regional distribution of cases received during the fiscal year 1945, compared with 1944
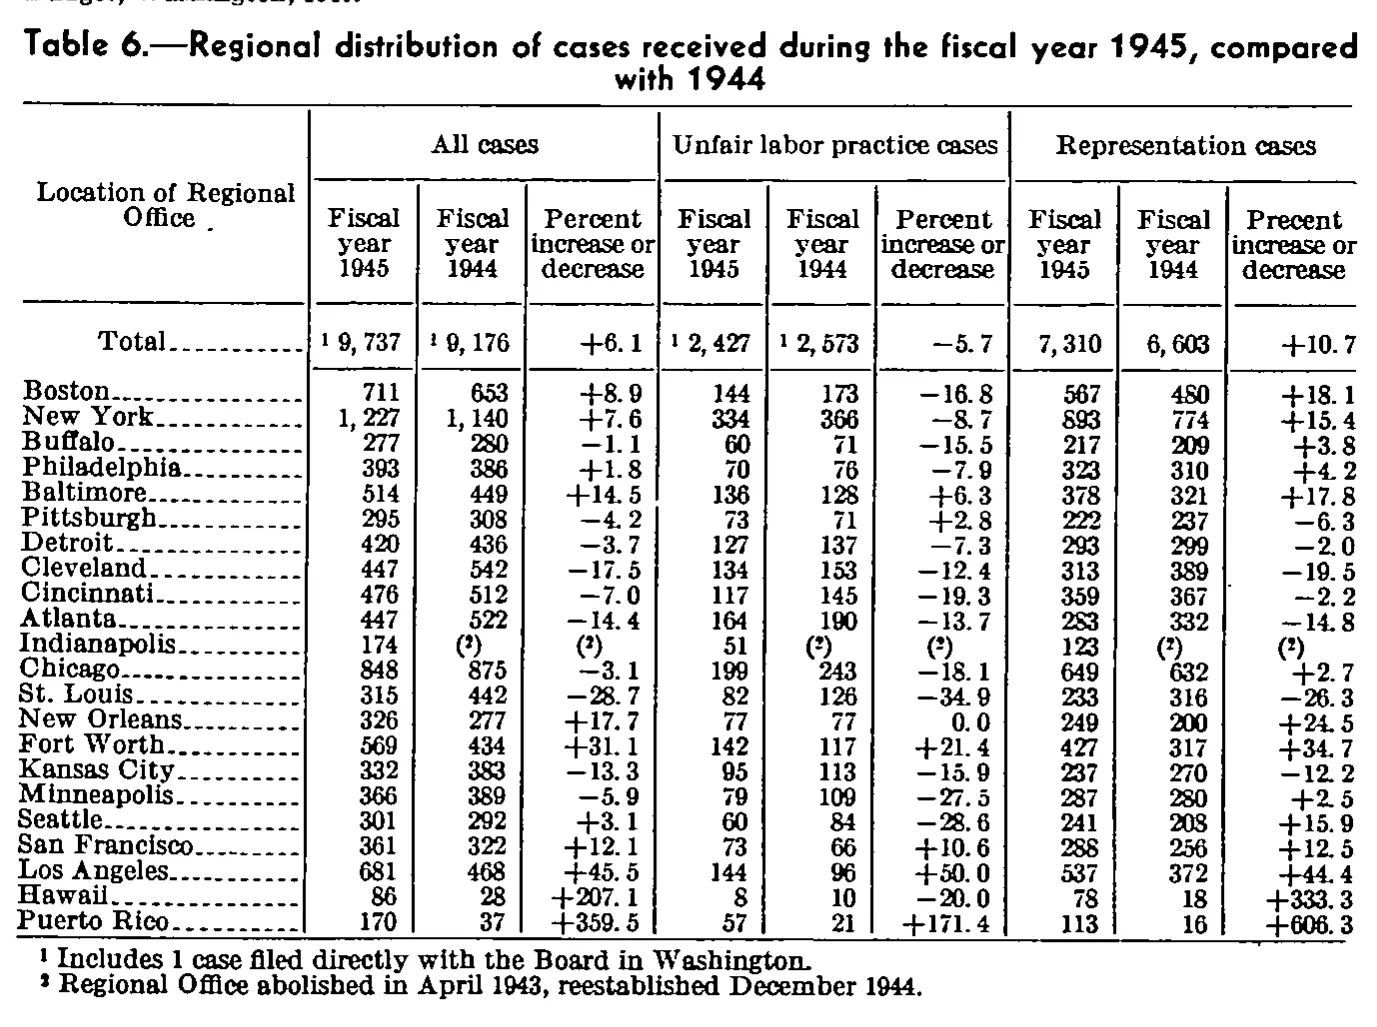
Regional distribution of cases received during the fiscal year 1945, compared with 1944
| Location of Regional Office | All cases | Unfair labor practice cases | Representation cases | ||||||
|---|---|---|---|---|---|---|---|---|---|
| Location of Regional Office | Fiscal year 1945 | Fiscal year 1944 | Percent increase or decrease | Fiscal year 1945 | Fiscal year 1944 | Percent increase or decrease | Fiscal year 1945 | Fiscal year 1944 | Precent increase or decrease |
| Total | 9,737 | 9,176 | +6.1 | 2,427 | 2,573 | -5.7 | 7,310 | 6,603 | +10.7 |
| Boston | 711 | 653 | +8.9 | 144 | 173 | -16.8 | 567 | 480 | +18.1 |
| New York | 1,227 | 1,140 | +7.6 | 334 | 366 | -8.7 | 893 | 774 | +15.4 |
| Buffalo | 277 | 280 | -1.1 | 60 | 71 | -15.5 | 217 | 209 | +3.8 |
| Philadelphia | 393 | 386 | +1.8 | 70 | 76 | -7.9 | 323 | 310 | +4.2 |
| Baltimore | 514 | 449 | +14.5 | 136 | 128 | +6.3 | 378 | 321 | +17.8 |
| Pittsburgh | 295 | 308 | -4.2 | 73 | 71 | +2.8 | 222 | 237 | -6.3 |
| Detroit | 420 | 436 | -3.7 | 127 | 137 | -7.3 | 293 | 299 | -2.0 |
| Cleveland | 447 | 542 | -17.5 | 134 | 153 | -12.4 | 313 | 389 | -19.5 |
| Cincinnati | 476 | 512 | -7.0 | 117 | 145 | -19.3 | 359 | 367 | -2.2 |
| Atlanta | 447 | 522 | -14.4 | 164 | 190 | -13.7 | 283 | 332 | -14.8 |
| Indianapolis | 174 | 51 | 123 | ||||||
| Chicago | 848 | 875 | -3.1 | 199 | 243 | -18.1 | 649 | 632 | +2.7 |
| St. Louis | 315 | 442 | -28.7 | 82 | 126 | -34.9 | 233 | 316 | -26.3 |
| New Orleans | 326 | 277 | +17.7 | 77 | 77 | 0.0 | 249 | 200 | +24.5 |
| Fort Worth | 569 | 434 | +31.1 | 142 | 117 | +21.4 | 427 | 317 | +34.7 |
| Kansas City | 332 | 383 | -13.3 | 95 | 113 | -15.9 | 237 | 270 | -12.2 |
| Minneapolis | 366 | 389 | -5.9 | 79 | 109 | -27.5 | 287 | 280 | +2.5 |
| Seattle | 301 | 292 | +3.1 | 60 | 84 | -28.6 | 241 | 208 | +15.9 |
| San Francisco | 361 | 322 | +12.1 | 73 | 66 | +10.6 | 288 | 256 | +12.5 |
| Los Angeles | 681 | 468 | +45.5 | 144 | 96 | +50.0 | 537 | 372 | +44.4 |
| Hawaii | 86 | 28 | +207.1 | 8 | 10 | -20.0 | 78 | 18 | +333.3 |
| Puerto Rico | 170 | 37 | +359.5 | 57 | 21 | +171.4 | 113 | 16 | +606.3 |
- 1 Includes 1 case filed directly with the Board in Washington.
- 2 Regional Office abolished in April 1943, reestablished December 1944.
0 of 135 figures sit in a row or column sum that works out.
Reader’s notes
p. 90. Ten columns: stub plus three panels of three columns each (All cases / Unfair labor practice cases / Representation cases), each with "Fiscal year 1945", "Fiscal year 1944", "Percent increase or decrease". Printed misprint kept as-is: the last column's heading reads "Precent increase or decrease" (the first two panels read "Percent"). Transcribed exactly as printed. In the Total row the raised footnote marker 1 is printed BEFORE each figure (e.g. "¹ 9,737"); per convention it is written after the value as "9,737^1". It appears on all four of: All cases 1945 and 1944, and Unfair labor practice 1945 and 1944; the three Representation cases cells carry no marker. The Indianapolis row has six cells containing only a parenthesized raised 2 (a footnote reference, not data) in the 1944 and percent columns of all three panels; these are written "(^2)" to preserve both the parentheses and the raised marker. Row labels are followed by leader dots in the original; these have been dropped. The stub heading is printed as "Location of Regional Office" with a stray mark (period) after "Office" on the second line, which has been omitted. Minus signs are printed as typographic en-dash-like minus glyphs and are transcribed as plain hyphen-minus. No values appear to be cut off by the crop; the caption and both footnotes are fully visible. Cross-checks of the Total row (2,427 + 7,310 = 9,737 and 2,573 + 6,603 = 9,176) are consistent as printed.
Source image
Source data: U.S. NLRB Annual Reports (public domain). Reconstruction by NLRB Stats Archive. Read by claude-opus-5 (effort max, prompt extract_v1) from the 300-dpi scan; stitched by page. Updated October 2026.