NLRB Stats Archive › Annual Reports › FY1945 › Distribution of cases received during the fiscal year 1945 and percent increase or decrease compared with the fiscal year 1944, by State
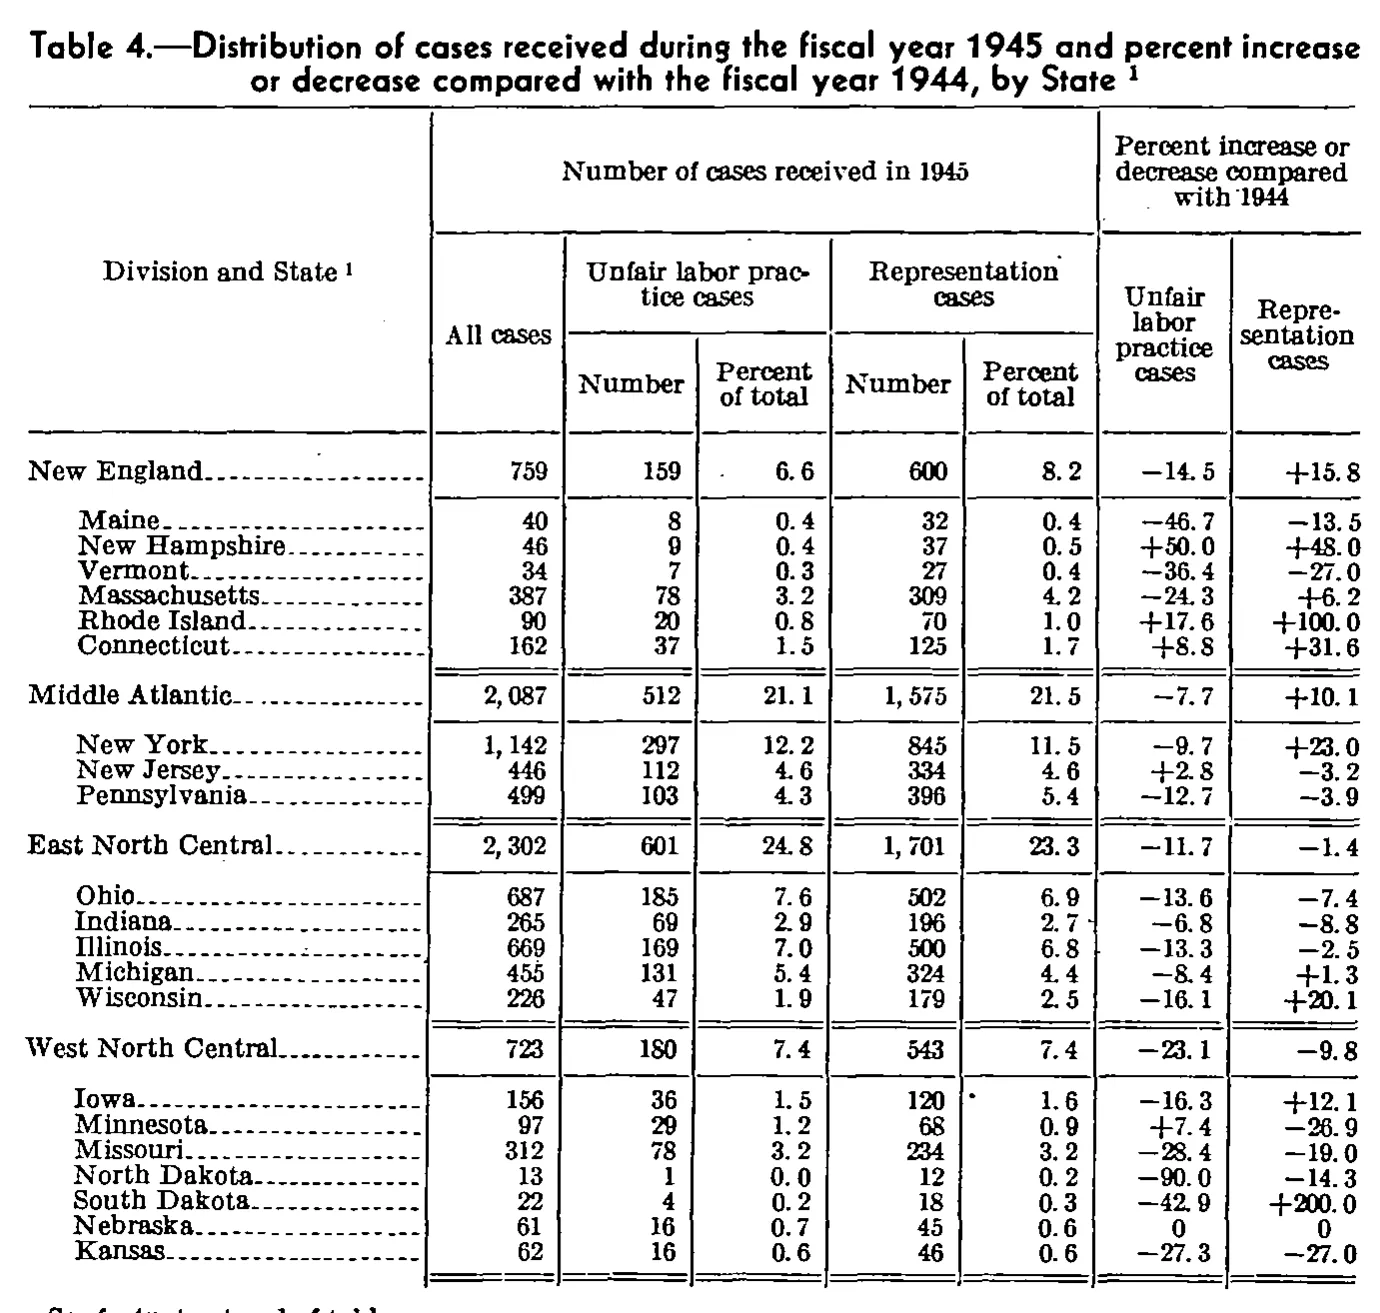
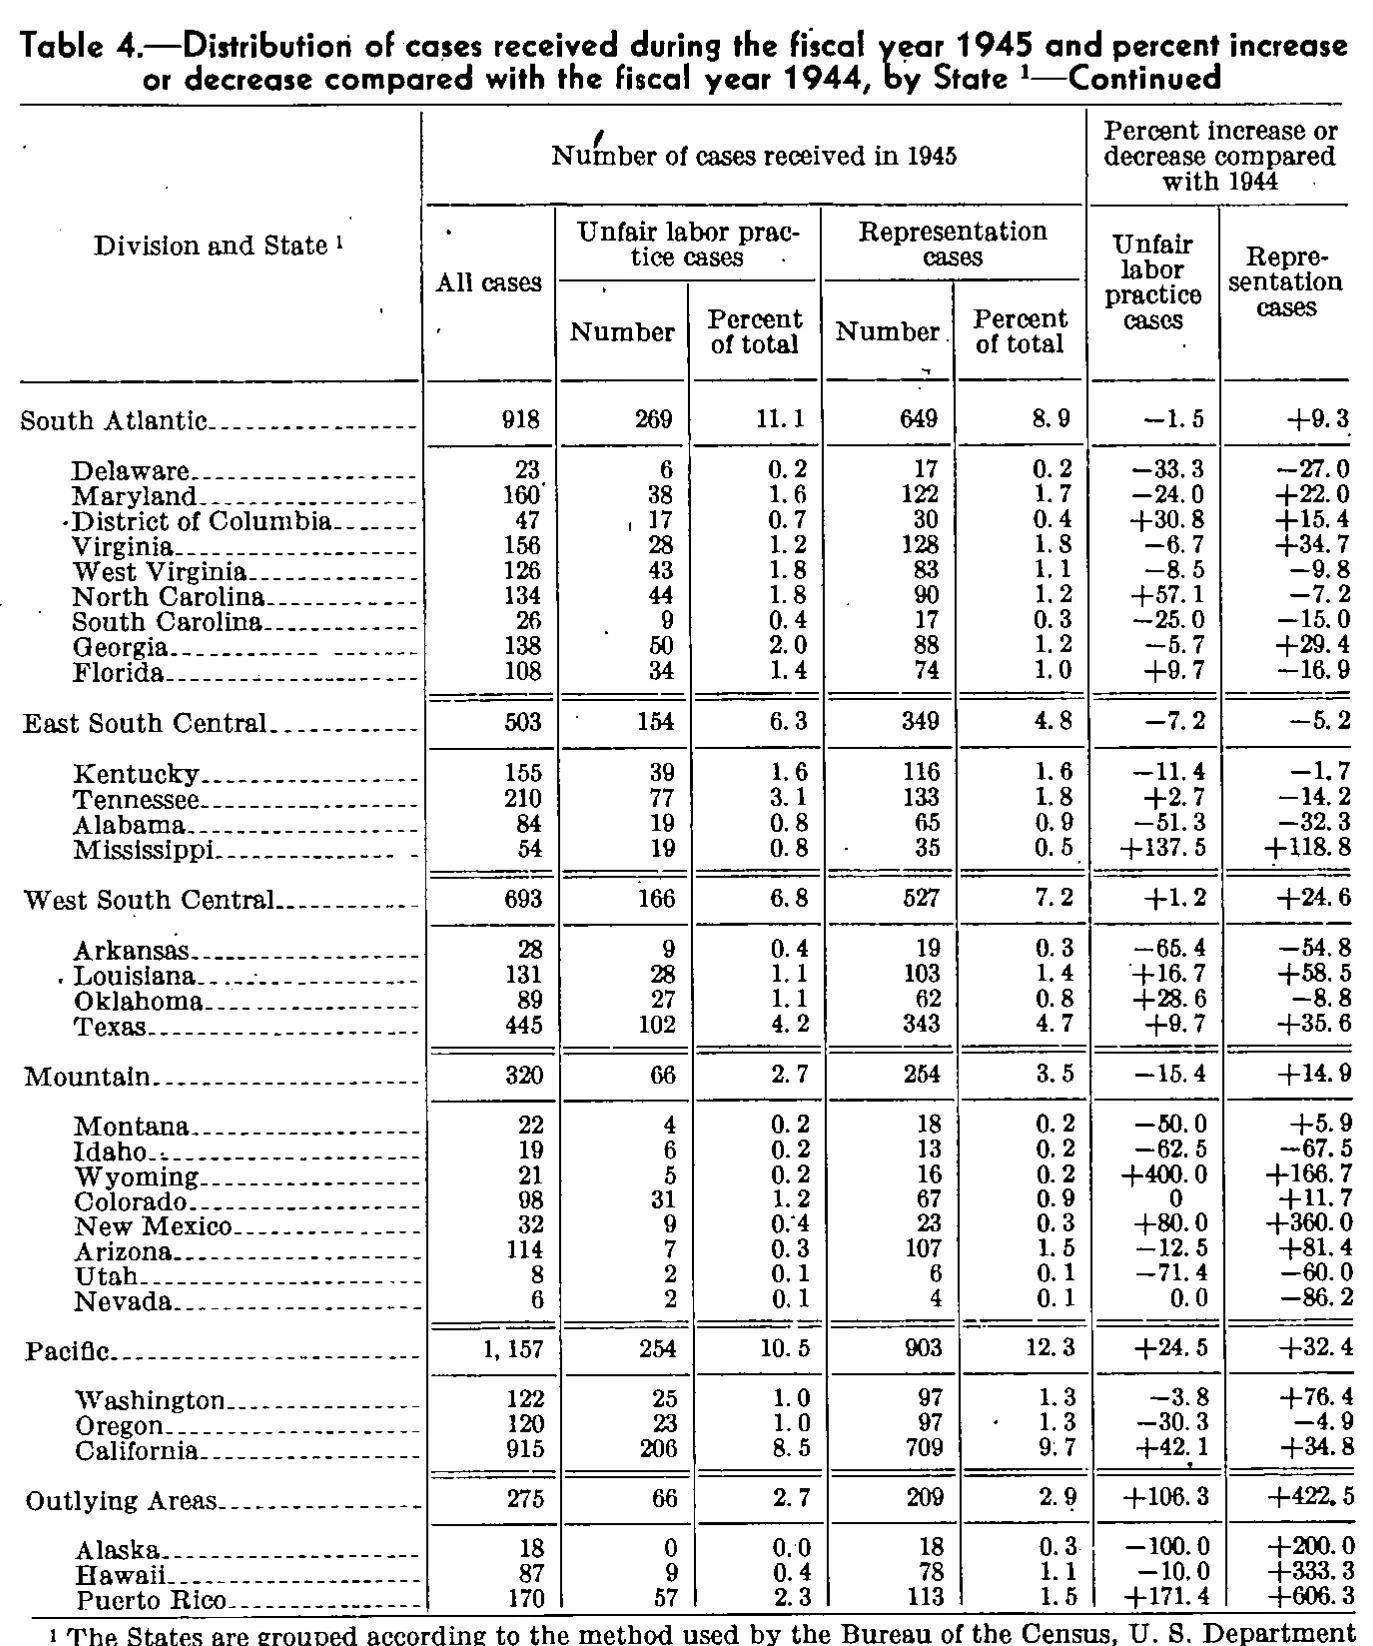
Distribution of cases received during the fiscal year 1945 and percent increase or decrease compared with the fiscal year 1944, by State
Stitched from pp. 88–89.
| Division and State | Number of cases received in 1945 | Percent increase or decrease compared with 1944 | |||||
|---|---|---|---|---|---|---|---|
| Division and State | All cases | Unfair labor practice cases | Representation cases | Unfair labor practice cases | Representation cases | ||
| Division and State | All cases | Number | Percent of total | Number | Percent of total | Unfair labor practice cases | Representation cases |
| New England | 759 | 159 | 6.6 | 600 | 8.2 | -14.5 | +15.8 |
| Maine | 40 | 8 | 0.4 | 32 | 0.4 | -46.7 | -13.5 |
| New Hampshire | 46 | 9 | 0.4 | 37 | 0.5 | +50.0 | +48.0 |
| Vermont | 34 | 7 | 0.3 | 27 | 0.4 | -36.4 | -27.0 |
| Massachusetts | 387 | 78 | 3.2 | 309 | 4.2 | -24.3 | +6.2 |
| Rhode Island | 90 | 20 | 0.8 | 70 | 1.0 | +17.6 | +100.0 |
| Connecticut | 162 | 37 | 1.5 | 125 | 1.7 | +8.8 | +31.6 |
| Middle Atlantic | 2,087 | 512 | 21.1 | 1,575 | 21.5 | -7.7 | +10.1 |
| New York | 1,142 | 297 | 12.2 | 845 | 11.5 | -9.7 | +23.0 |
| New Jersey | 446 | 112 | 4.6 | 334 | 4.6 | +2.8 | -3.2 |
| Pennsylvania | 499 | 103 | 4.3 | 396 | 5.4 | -12.7 | -3.9 |
| East North Central | 2,302 | 601 | 24.8 | 1,701 | 23.3 | -11.7 | -1.4 |
| Ohio | 687 | 185 | 7.6 | 502 | 6.9 | -13.6 | -7.4 |
| Indiana | 265 | 69 | 2.9 | 196 | 2.7 | -6.8 | -8.8 |
| Illinois | 669 | 169 | 7.0 | 500 | 6.8 | -13.3 | -2.5 |
| Michigan | 455 | 131 | 5.4 | 324 | 4.4 | -8.4 | +1.3 |
| Wisconsin | 226 | 47 | 1.9 | 179 | 2.5 | -16.1 | +20.1 |
| West North Central | 723 | 180 | 7.4 | 543 | 7.4 | -23.1 | -9.8 |
| Iowa | 156 | 36 | 1.5 | 120 | 1.6 | -16.3 | +12.1 |
| Minnesota | 97 | 29 | 1.2 | 68 | 0.9 | +7.4 | -26.9 |
| Missouri | 312 | 78 | 3.2 | 234 | 3.2 | -28.4 | -19.0 |
| North Dakota | 13 | 1 | 0.0 | 12 | 0.2 | -90.0 | -14.3 |
| South Dakota | 22 | 4 | 0.2 | 18 | 0.3 | -42.9 | +200.0 |
| Nebraska | 61 | 16 | 0.7 | 45 | 0.6 | 0 | 0 |
| Kansas | 62 | 16 | 0.6 | 46 | 0.6 | -27.3 | -27.0 |
| South Atlantic | 918 | 269 | 11.1 | 649 | 8.9 | -1.5 | +9.3 |
| Delaware | 23 | 6 | 0.2 | 17 | 0.2 | -33.3 | -27.0 |
| Maryland | 160 | 38 | 1.6 | 122 | 1.7 | -24.0 | +22.0 |
| District of Columbia | 47 | 17 | 0.7 | 30 | 0.4 | +30.8 | +15.4 |
| Virginia | 156 | 28 | 1.2 | 128 | 1.8 | -6.7 | +34.7 |
| West Virginia | 126 | 43 | 1.8 | 83 | 1.1 | -8.5 | -9.8 |
| North Carolina | 134 | 44 | 1.8 | 90 | 1.2 | +57.1 | -7.2 |
| South Carolina | 26 | 9 | 0.4 | 17 | 0.3 | -25.0 | -15.0 |
| Georgia | 138 | 50 | 2.0 | 88 | 1.2 | -5.7 | +29.4 |
| Florida | 108 | 34 | 1.4 | 74 | 1.0 | +9.7 | -16.9 |
| East South Central | 503 | 154 | 6.3 | 349 | 4.8 | -7.2 | -5.2 |
| Kentucky | 155 | 39 | 1.6 | 116 | 1.6 | -11.4 | -1.7 |
| Tennessee | 210 | 77 | 3.1 | 133 | 1.8 | +2.7 | -14.2 |
| Alabama | 84 | 19 | 0.8 | 65 | 0.9 | -51.3 | -32.3 |
| Mississippi | 54 | 19 | 0.8 | 35 | 0.5 | +137.5 | +118.8 |
| West South Central | 693 | 166 | 6.8 | 527 | 7.2 | +1.2 | +24.6 |
| Arkansas | 28 | 9 | 0.4 | 19 | 0.3 | -65.4 | -54.8 |
| Louisiana | 131 | 28 | 1.1 | 103 | 1.4 | +16.7 | +58.5 |
| Oklahoma | 89 | 27 | 1.1 | 62 | 0.8 | +28.6 | -8.8 |
| Texas | 445 | 102 | 4.2 | 343 | 4.7 | +9.7 | +35.6 |
| Mountain | 320 | 66 | 2.7 | 254 | 3.5 | -15.4 | +14.9 |
| Montana | 22 | 4 | 0.2 | 18 | 0.2 | -50.0 | +5.9 |
| Idaho | 19 | 6 | 0.2 | 13 | 0.2 | -62.5 | -67.5 |
| Wyoming | 21 | 5 | 0.2 | 16 | 0.2 | +400.0 | +166.7 |
| Colorado | 98 | 31 | 1.2 | 67 | 0.9 | 0 | +11.7 |
| New Mexico | 32 | 9 | 0.4 | 23 | 0.3 | +80.0 | +360.0 |
| Arizona | 114 | 7 | 0.3 | 107 | 1.5 | -12.5 | +81.4 |
| Utah | 8 | 2 | 0.1 | 6 | 0.1 | -71.4 | -60.0 |
| Nevada | 6 | 2 | 0.1 | 4 | 0.1 | 0.0 | -86.2 |
| Pacific | 1,157 | 254 | 10.5 | 903 | 12.3 | +24.5 | +32.4 |
| Washington | 122 | 25 | 1.0 | 97 | 1.3 | -3.8 | +76.4 |
| Oregon | 120 | 23 | 1.0 | 97 | 1.3 | -30.3 | -4.9 |
| California | 915 | 206 | 8.5 | 709 | 9.7 | +42.1 | +34.8 |
| Outlying Areas | 275 | 66 | 2.7 | 209 | 2.9 | +106.3 | +422.5 |
| Alaska | 18 | 0 | 0.0 | 18 | 0.3 | -100.0 | +200.0 |
| Hawaii | 87 | 9 | 0.4 | 78 | 1.1 | -10.0 | +333.3 |
| Puerto Rico | 170 | 57 | 2.3 | 113 | 1.5 | +171.4 | +606.3 |
- 1 The States are grouped according to the method used by the Bureau of the Census, U. S. Department
185 of 185 figures sit in a row or column sum that works out.
Reader’s notes
p. 88. The crop ends after the Kansas row, below the double rule closing the West North Central block; the table continues on the following page(s) with the remaining divisions. A line of text is partly visible at the very bottom edge, almost certainly the standard "See footnotes at end of table" note, but it is clipped and illegible, so no footnote text is reported. Footnote marker 1 appears on the caption (excluded) and on the stub heading "Division and State"; its text is not printed within this crop. Possible misprint as printed: Nebraska and Kansas both show 16 unfair labor practice cases but different percents of total (0.7 and 0.6 respectively). Transcribed as printed, not reconciled. Nebraska's two percent-change cells are printed as a bare "0" (no sign), unlike the signed values elsewhere; transcribed as "0". Minus signs are printed as a short dash glyph; rendered here as ASCII hyphen-minus. Stray ink specks sit in the Representation "Percent of total" column beside New England (6.6 column area) and beside Iowa (120); they are not digits or footnote markers.
p. 89. This is a continuation page: the caption reads "—Continued" and the body starts mid-table at the South Atlantic division, so the Northeastern/North Central divisions and any grand total are on the preceding page, not in this crop. Footnote 1 is cut off by the bottom edge of the crop; it is transcribed only as far as the visible text ("...U. S. Department"), and the remainder (presumably "of Commerce." or similar) is not readable here. Doubtful/notable cells: - Colorado, "Percent increase or decrease compared with 1944 / Unfair labor practice cases": printed as a bare "0" with no decimal, unlike Nevada in the same column which is printed "0.0". Transcribed as printed. - Alaska, "Unfair labor practice cases / Percent of total": printed "0. 0" with the usual post-point space; read as 0.0. - Arizona, "Unfair labor practice cases / Number" is 7 and "Representation cases / Number" is 107; the small 7 is slightly faint but 7 + 107 = 114 matches the All cases entry. - California, "Representation cases / Percent of total" is printed with a dirty point that can look like a colon ("9: 7"); read as 9.7. - Pacific "All cases" is typeset "1, 157" with a space after the comma; written 1,157 per instructions. Arithmetic checks (not corrections): every division total equals the sum of its listed States, and in every State row All cases = unfair labor practice Number + representation Number. No internal inconsistency was found. Scan artifacts: stray ink specks appear in the stub column and in the heading area (a tick above "Number of cases received in 1945" and marks near "All cases"); these are not footnote markers and were ignored.
Source image
Source data: U.S. NLRB Annual Reports (public domain). Reconstruction by NLRB Stats Archive. Read by claude-opus-5 (effort max, prompt extract_v1) from the 300-dpi scan; stitched by page. Updated October 2026.