NLRB Stats Archive › Annual Reports › FY1945 › Distribution of cases received — by State
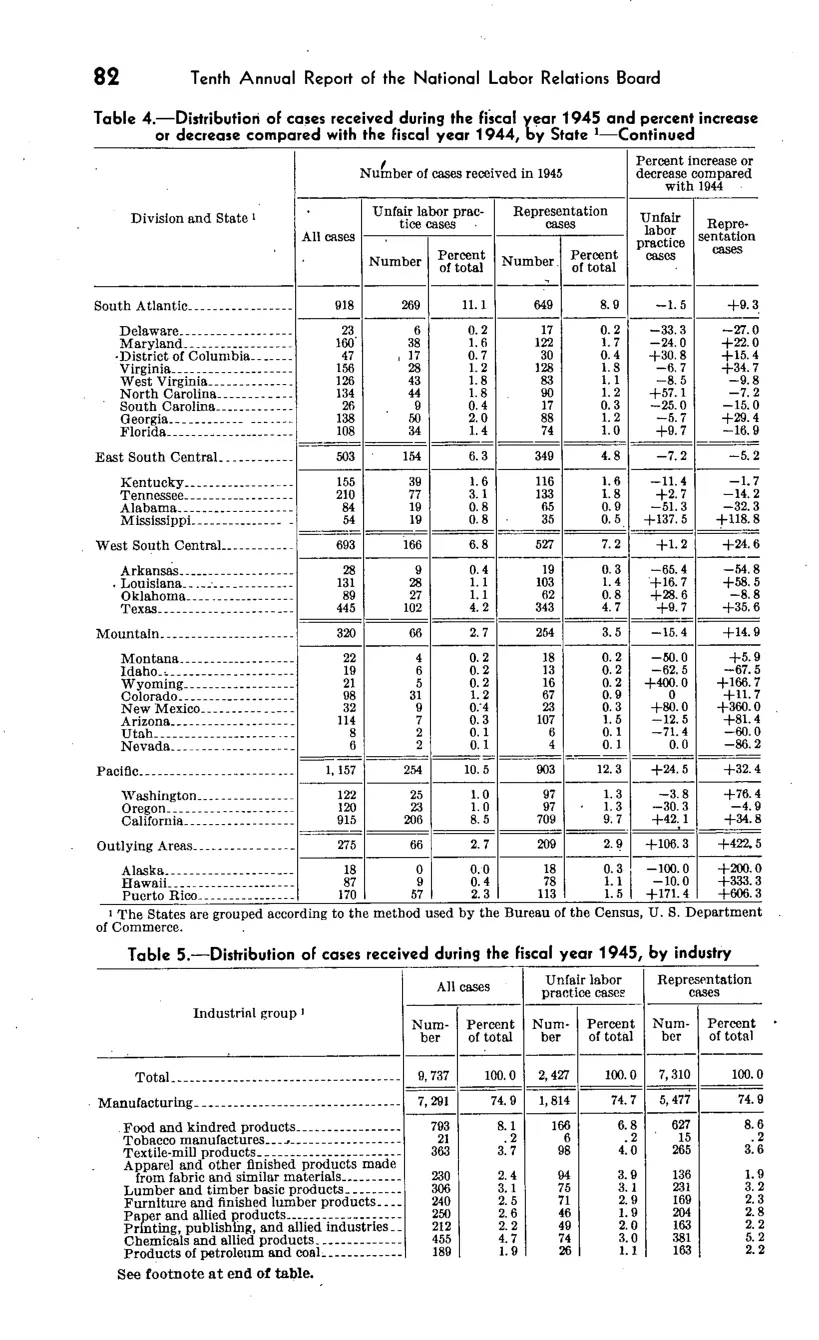
Distribution of cases received — by State
| Division and State | Number of cases received in 1945 | Number of cases received in 1945 | Number of cases received in 1945 | Number of cases received in 1945 | Number of cases received in 1945 | Percent increase or decrease compared with 1944 | Percent increase or decrease compared with 1944 |
|---|---|---|---|---|---|---|---|
| Division and State | All cases | Unfair labor practice cases | Unfair labor practice cases | Representation cases | Representation cases | Unfair labor practice cases | Representation cases |
| Division and State | All cases | Number | Percent of total | Number | Percent of total | Unfair labor practice cases | Representation cases |
| South Atlantic | 918 | 269 | 11.1 | 649 | 8.9 | -1.5 | +9.3 |
| East South Central | 503 | 154 | 6.3 | 349 | 4.8 | -7.2 | -5.2 |
| West South Central | 693 | 166 | 6.8 | 527 | 7.2 | +1.2 | +24.6 |
| Mountain | 320 | 66 | 2.7 | 254 | 3.5 | -15.4 | +14.9 |
| Pacific | 1,157 | 254 | 10.5 | 903 | 12.3 | +24.5 | +32.4 |
| Outlying Areas | 275 | 66 | 2.7 | 209 | 2.9 | +106.3 | +422.5 |
Source image
Source data: U.S. NLRB Annual Reports (public domain). Reconstruction by NLRB Stats Archive. Updated June 2026.