NLRB Stats Archive › Annual Reports › FY1944 › Distribution of cases received during the fiscal year 1944, by industry
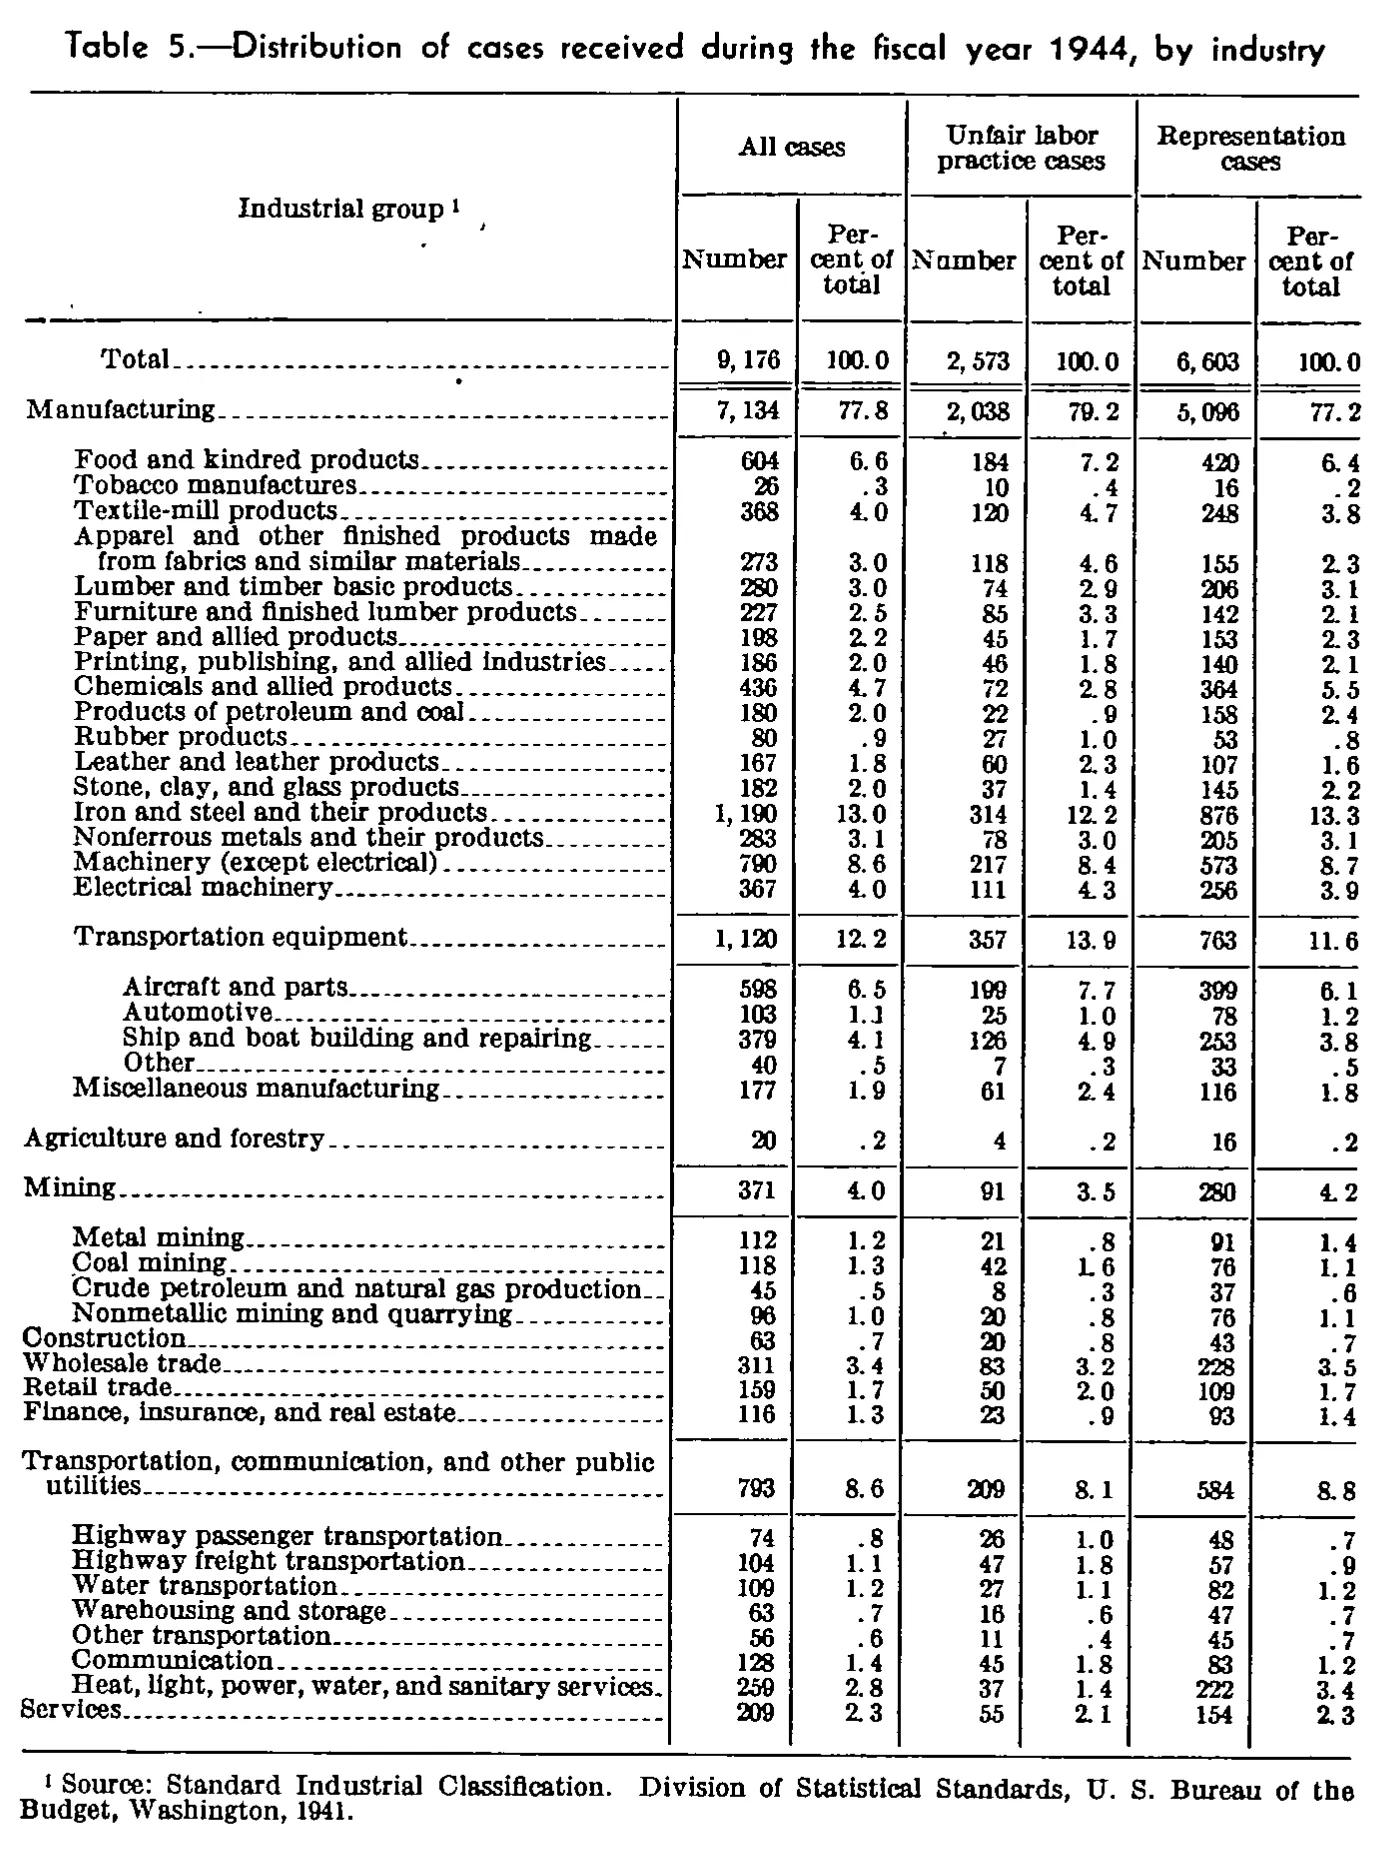
Distribution of cases received during the fiscal year 1944, by industry
| Industrial group | All cases | Unfair labor practice cases | Representation cases | |||
|---|---|---|---|---|---|---|
| Industrial group | Number | Percent of total | Number | Percent of total | Number | Percent of total |
| Total | 9,176 | 100.0 | 2,573 | 100.0 | 6,603 | 100.0 |
| Manufacturing | 7,134 | 77.8 | 2,038 | 79.2 | 5,096 | 77.2 |
| Food and kindred products | 604 | 6.6 | 184 | 7.2 | 420 | 6.4 |
| Tobacco manufactures | 26 | .3 | 10 | .4 | 16 | .2 |
| Textile-mill products | 368 | 4.0 | 120 | 4.7 | 248 | 3.8 |
| Apparel and other finished products made from fabrics and similar materials | 273 | 3.0 | 118 | 4.6 | 155 | 2.3 |
| Lumber and timber basic products | 280 | 3.0 | 74 | 2.9 | 206 | 3.1 |
| Furniture and finished lumber products | 227 | 2.5 | 85 | 3.3 | 142 | 2.1 |
| Paper and allied products | 198 | 2.2 | 45 | 1.7 | 153 | 2.3 |
| Printing, publishing, and allied industries | 186 | 2.0 | 46 | 1.8 | 140 | 2.1 |
| Chemicals and allied products | 436 | 4.7 | 72 | 2.8 | 364 | 5.5 |
| Products of petroleum and coal | 180 | 2.0 | 22 | .9 | 158 | 2.4 |
| Rubber products | 80 | .9 | 27 | 1.0 | 53 | .8 |
| Leather and leather products | 167 | 1.8 | 60 | 2.3 | 107 | 1.6 |
| Stone, clay, and glass products | 182 | 2.0 | 37 | 1.4 | 145 | 2.2 |
| Iron and steel and their products | 1,190 | 13.0 | 314 | 12.2 | 876 | 13.3 |
| Nonferrous metals and their products | 283 | 3.1 | 78 | 3.0 | 205 | 3.1 |
| Machinery (except electrical) | 790 | 8.6 | 217 | 8.4 | 573 | 8.7 |
| Electrical machinery | 367 | 4.0 | 111 | 4.3 | 256 | 3.9 |
| Transportation equipment | 1,120 | 12.2 | 357 | 13.9 | 763 | 11.6 |
| Aircraft and parts | 598 | 6.5 | 199 | 7.7 | 399 | 6.1 |
| Automotive | 103 | 1.1 | 25 | 1.0 | 78 | 1.2 |
| Ship and boat building and repairing | 379 | 4.1 | 126 | 4.9 | 253 | 3.8 |
| Other | 40 | .5 | 7 | .3 | 33 | .5 |
| Miscellaneous manufacturing | 177 | 1.9 | 61 | 2.4 | 116 | 1.8 |
| Agriculture and forestry | 20 | .2 | 4 | .2 | 16 | .2 |
| Mining | 371 | 4.0 | 91 | 3.5 | 280 | 4.2 |
| Metal mining | 112 | 1.2 | 21 | .8 | 91 | 1.4 |
| Coal mining | 118 | 1.3 | 42 | 1.6 | 76 | 1.1 |
| Crude petroleum and natural gas production | 45 | .5 | 8 | .3 | 37 | .6 |
| Nonmetallic mining and quarrying | 96 | 1.0 | 20 | .8 | 76 | 1.1 |
| Construction | 63 | .7 | 20 | .8 | 43 | .7 |
| Wholesale trade | 311 | 3.4 | 83 | 3.2 | 228 | 3.5 |
| Retail trade | 159 | 1.7 | 50 | 2.0 | 109 | 1.7 |
| Finance, insurance, and real estate | 116 | 1.3 | 23 | .9 | 93 | 1.4 |
| Transportation, communication, and other public utilities | 793 | 8.6 | 209 | 8.1 | 584 | 8.8 |
| Highway passenger transportation | 74 | .8 | 26 | 1.0 | 48 | .7 |
| Highway freight transportation | 104 | 1.1 | 47 | 1.8 | 57 | .9 |
| Water transportation | 109 | 1.2 | 27 | 1.1 | 82 | 1.2 |
| Warehousing and storage | 63 | .7 | 16 | .6 | 47 | .7 |
| Other transportation | 56 | .6 | 11 | .4 | 45 | .7 |
| Communication | 128 | 1.4 | 45 | 1.8 | 83 | 1.2 |
| Heat, light, power, water, and sanitary services | 259 | 2.8 | 37 | 1.4 | 222 | 3.4 |
| Services | 209 | 2.3 | 55 | 2.1 | 154 | 2.3 |
- 1 Source: Standard Industrial Classification. Division of Statistical Standards, U. S. Bureau of the Budget, Washington, 1941.
132 of 132 figures sit in a row or column sum that works out.
Reader’s notes
p. 85. Seven columns: stub plus Number/Percent of total under each of the three case-type headings. The stub heading carries footnote marker 1, repeated across both heading levels along with the spanning case-type headings. Indentation (not preserved in the flat grid): "Manufacturing", "Agriculture and forestry", "Mining", "Construction", "Wholesale trade", "Retail trade", "Finance, insurance, and real estate", "Transportation, communication, and other public utilities" and "Services" are top-level industry divisions; the rows between them are components. "Transportation equipment" (1,120) is a manufacturing component set off by rules, and "Aircraft and parts", "Automotive", "Ship and boat building and repairing" and "Other" are its four sub-components (they sum to 1,120; they are indented one step deeper than the other manufacturing lines). Percent cells under 1 are printed without a leading zero (".3", ".9"); transcribed as printed. "Coal mining", Unfair labor practice cases Percent of total: the scan renders the value with a broken "1" that resembles "L6"; read as 1.6, consistent with 42/2,573 = 1.63 percent. Arithmetic check (not applied to any cell): every row's All-cases Number equals its Unfair labor practice Number plus Representation Number, and the two detail groups that have sub-lines (Transportation equipment) sum correctly, so no misprint is suspected in the Number columns.
Source image
Source data: U.S. NLRB Annual Reports (public domain). Reconstruction by NLRB Stats Archive. Read by claude-opus-5 (effort max, prompt extract_v1) from the 300-dpi scan; stitched by page. Updated October 2026.