NLRB Stats Archive › Annual Reports › FY1944 › Distribution of cases received during the fiscal year 1944 and percent increase or decrease compared with the fiscal year 1943, by State
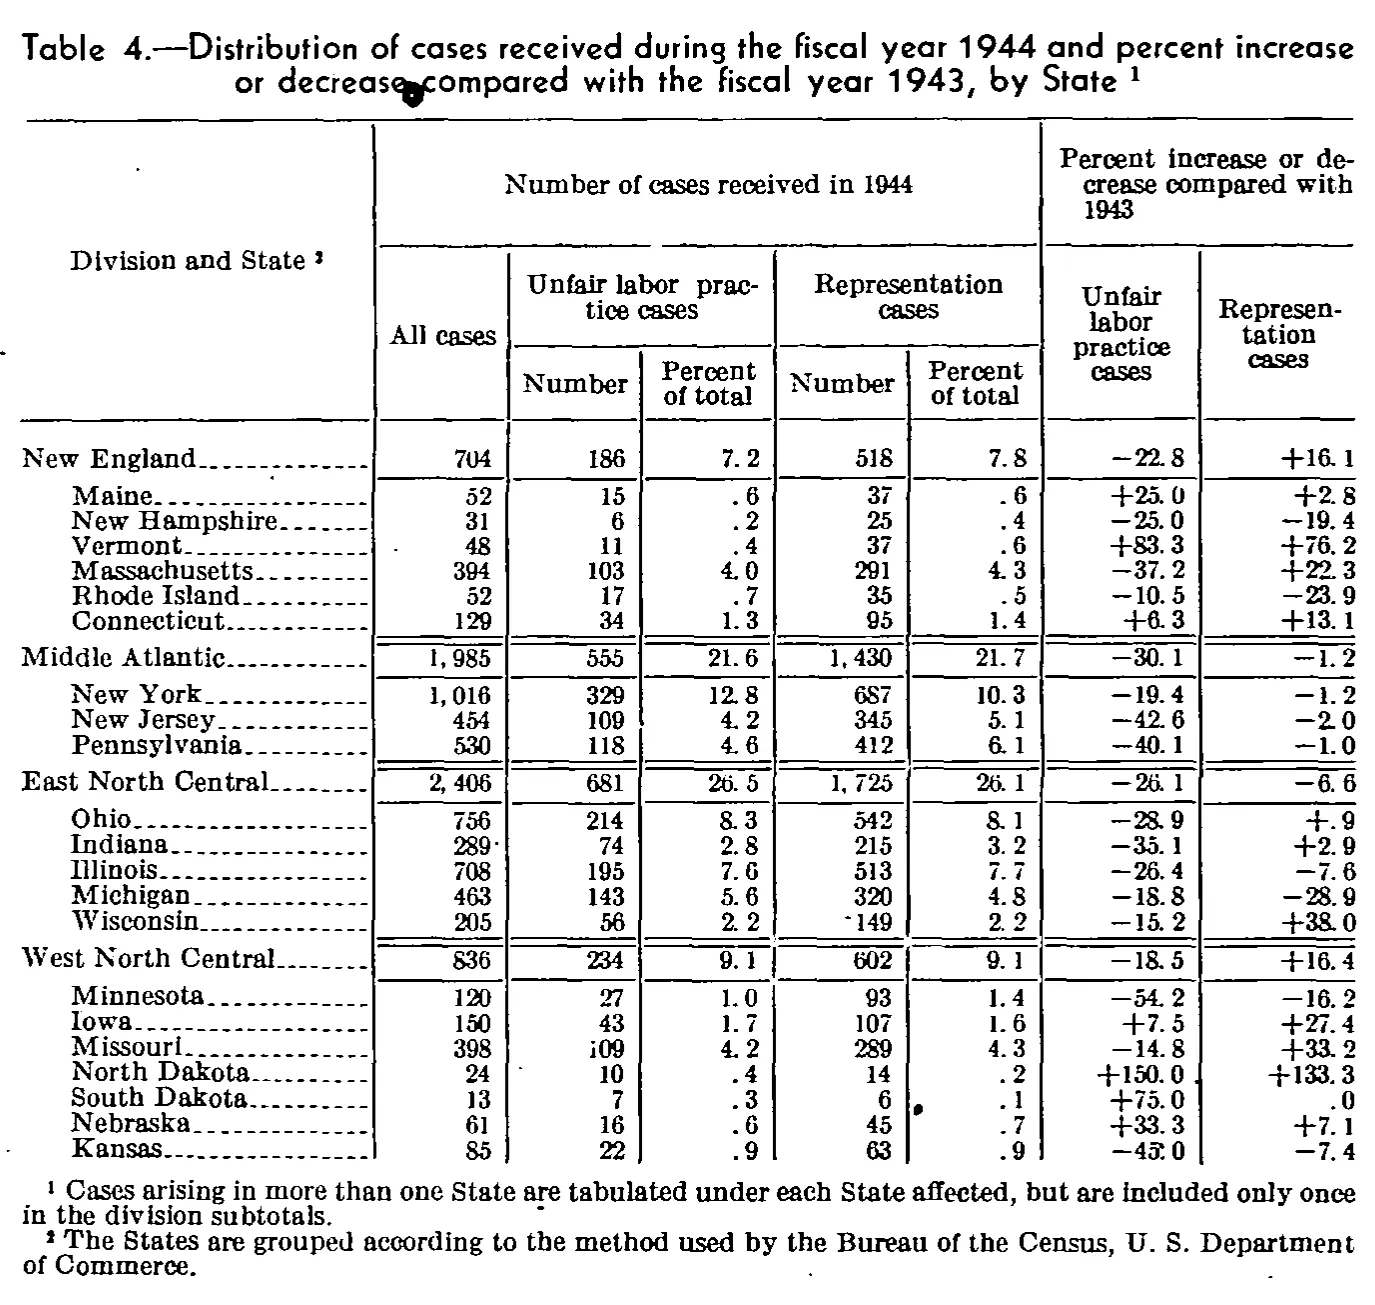
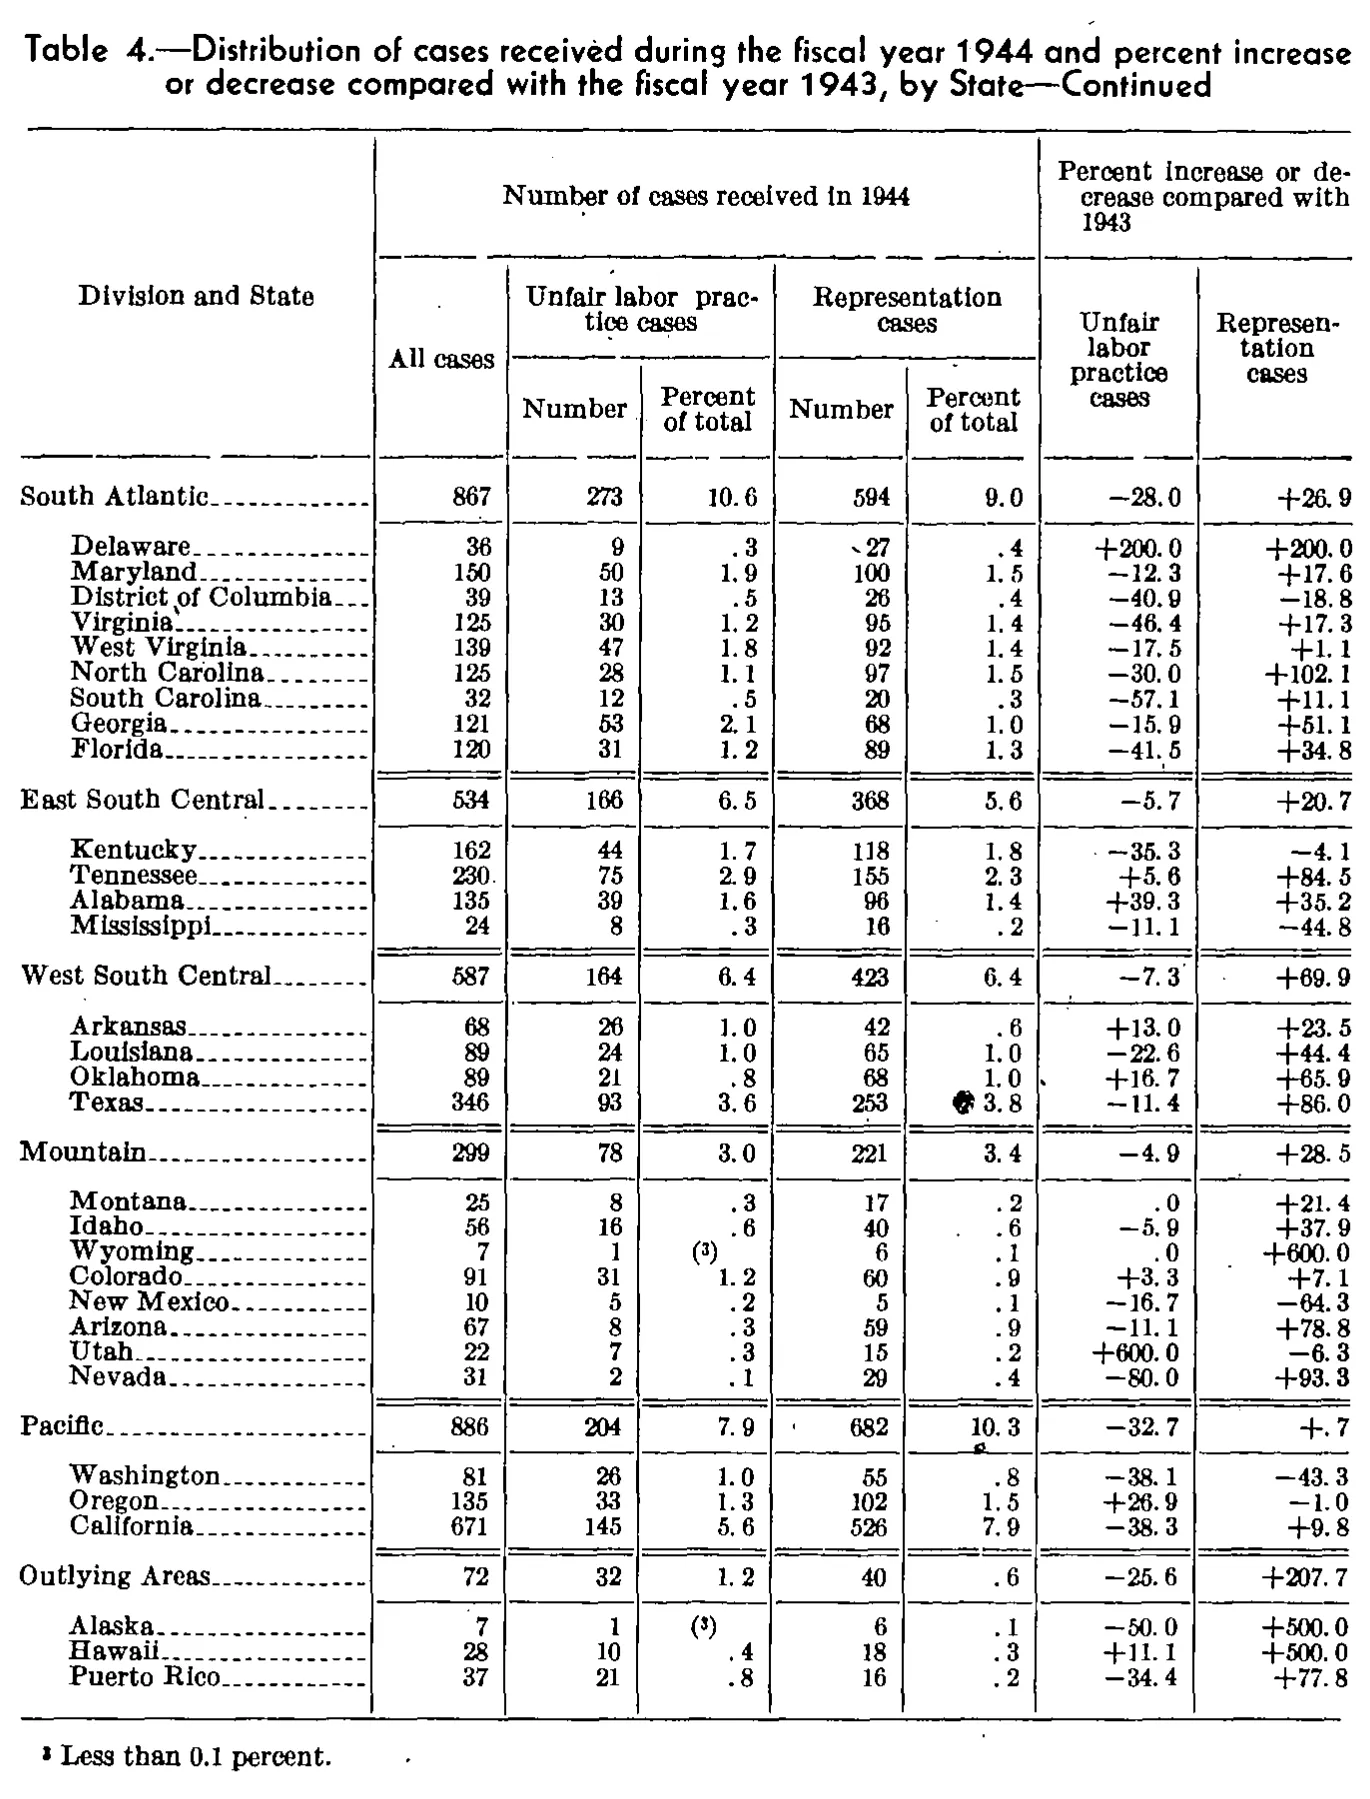
Distribution of cases received during the fiscal year 1944 and percent increase or decrease compared with the fiscal year 1943, by State
Stitched from pp. 83–84.
| Division and State | Number of cases received in 1944 | Percent increase or decrease compared with 1943 | |||||
|---|---|---|---|---|---|---|---|
| Division and State | All cases | Unfair labor practice cases | Representation cases | Unfair labor practice cases | Representation cases | ||
| Division and State | All cases | Number | Percent of total | Number | Percent of total | Unfair labor practice cases | Representation cases |
| New England | 704 | 186 | 7.2 | 518 | 7.8 | -22.8 | +16.1 |
| Maine | 52 | 15 | .6 | 37 | .6 | +25.0 | +2.8 |
| New Hampshire | 31 | 6 | .2 | 25 | .4 | -25.0 | -19.4 |
| Vermont | 48 | 11 | .4 | 37 | .6 | +83.3 | +76.2 |
| Massachusetts | 394 | 103 | 4.0 | 291 | 4.3 | -37.2 | +22.3 |
| Rhode Island | 52 | 17 | .7 | 35 | .5 | -10.5 | -23.9 |
| Connecticut | 129 | 34 | 1.3 | 95 | 1.4 | +6.3 | +13.1 |
| Middle Atlantic | 1,985 | 555 | 21.6 | 1,430 | 21.7 | -30.1 | -1.2 |
| New York | 1,016 | 329 | 12.8 | 687 | 10.3 | -19.4 | -1.2 |
| New Jersey | 454 | 109 | 4.2 | 345 | 5.1 | -42.6 | -2.0 |
| Pennsylvania | 530 | 118 | 4.6 | 412 | 6.1 | -40.1 | -1.0 |
| East North Central | 2,406 | 681 | 26.5 | 1,725 | 26.1 | -26.1 | -6.6 |
| Ohio | 756 | 214 | 8.3 | 542 | 8.1 | -28.9 | +.9 |
| Indiana | 289 | 74 | 2.8 | 215 | 3.2 | -35.1 | +2.9 |
| Illinois | 708 | 195 | 7.6 | 513 | 7.7 | -26.4 | -7.6 |
| Michigan | 463 | 143 | 5.6 | 320 | 4.8 | -18.8 | -28.9 |
| Wisconsin | 205 | 56 | 2.2 | 149 | 2.2 | -15.2 | +38.0 |
| West North Central | 836 | 234 | 9.1 | 602 | 9.1 | -18.5 | +16.4 |
| Minnesota | 120 | 27 | 1.0 | 93 | 1.4 | -54.2 | -16.2 |
| Iowa | 150 | 43 | 1.7 | 107 | 1.6 | +7.5 | +27.4 |
| Missouri | 398 | 109 | 4.2 | 289 | 4.3 | -14.8 | +33.2 |
| North Dakota | 24 | 10 | .4 | 14 | .2 | +150.0 | +133.3 |
| South Dakota | 13 | 7 | .3 | 6 | .1 | +75.0 | .0 |
| Nebraska | 61 | 16 | .6 | 45 | .7 | +33.3 | +7.1 |
| Kansas | 85 | 22 | .9 | 63 | .9 | -45.0 | -7.4 |
| South Atlantic | 867 | 273 | 10.6 | 594 | 9.0 | -28.0 | +26.9 |
| Delaware | 36 | 9 | .3 | 27 | .4 | +200.0 | +200.0 |
| Maryland | 150 | 50 | 1.9 | 100 | 1.5 | -12.3 | +17.6 |
| District of Columbia | 39 | 13 | .5 | 26 | .4 | -40.9 | -18.8 |
| Virginia | 125 | 30 | 1.2 | 95 | 1.4 | -46.4 | +17.3 |
| West Virginia | 139 | 47 | 1.8 | 92 | 1.4 | -17.5 | +1.1 |
| North Carolina | 125 | 28 | 1.1 | 97 | 1.5 | -30.0 | +102.1 |
| South Carolina | 32 | 12 | .5 | 20 | .3 | -57.1 | +11.1 |
| Georgia | 121 | 53 | 2.1 | 68 | 1.0 | -15.9 | +51.1 |
| Florida | 120 | 31 | 1.2 | 89 | 1.3 | -41.5 | +34.8 |
| East South Central | 534 | 166 | 6.5 | 368 | 5.6 | -5.7 | +20.7 |
| Kentucky | 162 | 44 | 1.7 | 118 | 1.8 | -35.3 | -4.1 |
| Tennessee | 230 | 75 | 2.9 | 155 | 2.3 | +5.6 | +84.5 |
| Alabama | 135 | 39 | 1.6 | 96 | 1.4 | +39.3 | +35.2 |
| Mississippi | 24 | 8 | .3 | 16 | .2 | -11.1 | -44.8 |
| West South Central | 587 | 164 | 6.4 | 423 | 6.4 | -7.3 | +69.9 |
| Arkansas | 68 | 26 | 1.0 | 42 | .6 | +13.0 | +23.5 |
| Louisiana | 89 | 24 | 1.0 | 65 | 1.0 | -22.6 | +44.4 |
| Oklahoma | 89 | 21 | .8 | 68 | 1.0 | +16.7 | +65.9 |
| Texas | 346 | 93 | 3.6 | 253 | 3.8 | -11.4 | +86.0 |
| Mountain | 299 | 78 | 3.0 | 221 | 3.4 | -4.9 | +28.5 |
| Montana | 25 | 8 | .3 | 17 | .2 | .0 | +21.4 |
| Idaho | 56 | 16 | .6 | 40 | .6 | -5.9 | +37.9 |
| Wyoming | 7 | 1 | [3] | 6 | .1 | .0 | +600.0 |
| Colorado | 91 | 31 | 1.2 | 60 | .9 | +3.3 | +7.1 |
| New Mexico | 10 | 5 | .2 | 5 | .1 | -16.7 | -64.3 |
| Arizona | 67 | 8 | .3 | 59 | .9 | -11.1 | +78.8 |
| Utah | 22 | 7 | .3 | 15 | .2 | +600.0 | -6.3 |
| Nevada | 31 | 2 | .1 | 29 | .4 | -80.0 | +93.3 |
| Pacific | 886 | 204 | 7.9 | 682 | 10.3 | -32.7 | +.7 |
| Washington | 81 | 26 | 1.0 | 55 | .8 | -38.1 | -43.3 |
| Oregon | 135 | 33 | 1.3 | 102 | 1.5 | +26.9 | -1.0 |
| California | 671 | 145 | 5.6 | 526 | 7.9 | -38.3 | +9.8 |
| Outlying Areas | 72 | 32 | 1.2 | 40 | .6 | -25.6 | +207.7 |
| Alaska | 7 | 1 | [3] | 6 | .1 | -50.0 | +500.0 |
| Hawaii | 28 | 10 | .4 | 18 | .3 | +11.1 | +500.0 |
| Puerto Rico | 37 | 21 | .8 | 16 | .2 | -34.4 | +77.8 |
- 1 Cases arising in more than one State are tabulated under each State affected, but are included only once in the division subtotals.
- 2 The States are grouped according to the method used by the Bureau of the Census, U. S. Department of Commerce.
- 3 Less than 0.1 percent.
186 of 186 figures sit in a row or column sum that works out.
Reader’s notes
p. 83. The table is 8 columns: stub, All cases, then Number / Percent of total under "Unfair labor practice cases" and under "Representation cases" (all four within the "Number of cases received in 1944" spanner), then Unfair labor practice cases / Representation cases under the "Percent increase or decrease compared with 1943" spanner. The crop ends after Kansas (West North Central division); the remaining divisions (South Atlantic onward) are not on this page, so the table continues elsewhere. The two footnotes shown are printed on this page. Doubtful cells, all read from a somewhat degraded scan: - Kansas, "Percent increase or decrease ... Unfair labor practice cases": the second digit is smudged; read as -45.0, but -43.0 or -46.0 cannot be ruled out. - Missouri, "Unfair labor practice cases / Number": the leading 1 is broken in the scan (prints like "i09"); read as 109. It is consistent with 109 + 289 = 398. - New York, "Representation cases / Number": prints like "6S7"; read as 687, consistent with 329 + 687 = 1,016. - Wisconsin "Representation cases / Number" (149) and South Dakota "Representation cases / Percent of total" (.1) each have a stray ink dot just to the left of the value; treated as scan speckle, not part of the figure. Likewise a stray dot follows Indiana's "289". All division subtotals and all state rows satisfy All cases = unfair labor practice number + representation number as printed; no arithmetic was performed on or applied to any cell. Minus signs are printed as en-dashes in the original and are transcribed as hyphen-minus.
p. 84. This crop is the continuation page of Table 4; the column headings are reprinted here, so they are transcribed. The table begins on the previous page (the New England through East North Central / West North Central divisions are not in this crop), and there is no grand-total row on this page. The footnote marker is a small raised numeral that reads as 3 in this scan (it is set in a slightly degraded superscript face and could conceivably be a 2 or a dagger-like symbol); it is transcribed as 3 in both the footnote line and in the two cells that carry it as a stand-in value: Wyoming and Alaska, column "Unfair labor practice cases / Percent of total", each printed as a parenthesized raised 3, transcribed "(3)". In the Alaska/Hawaii block the "(3)" sits visually between the Alaska and Hawaii lines but aligns with Alaska's baseline; Hawaii's own value in that column is ".4". Texas, column "Representation cases / Percent of total": a round ink blot sits immediately left of the figure; the value itself reads clearly as 3.8. A similar stray ink speck sits just below the Pacific row's "10.3" in the same column and is not part of any value. Several percent cells are printed without a leading zero (".3", ".4", "+.7") and are transcribed exactly as printed. Minus signs are the printed en-dash-like minus, transcribed as a hyphen-minus. Division rows (South Atlantic, East South Central, West South Central, Mountain, Pacific, Outlying Areas) are subtotal rows set flush left and carry values; state rows are indented under them.
Source image
Source data: U.S. NLRB Annual Reports (public domain). Reconstruction by NLRB Stats Archive. Read by claude-opus-5 (effort max, prompt extract_v1) from the 300-dpi scan; stitched by page. Updated October 2026.