NLRB Stats Archive › Annual Reports › FY1944 › Cases filed during the fiscal years 1936-44, by type
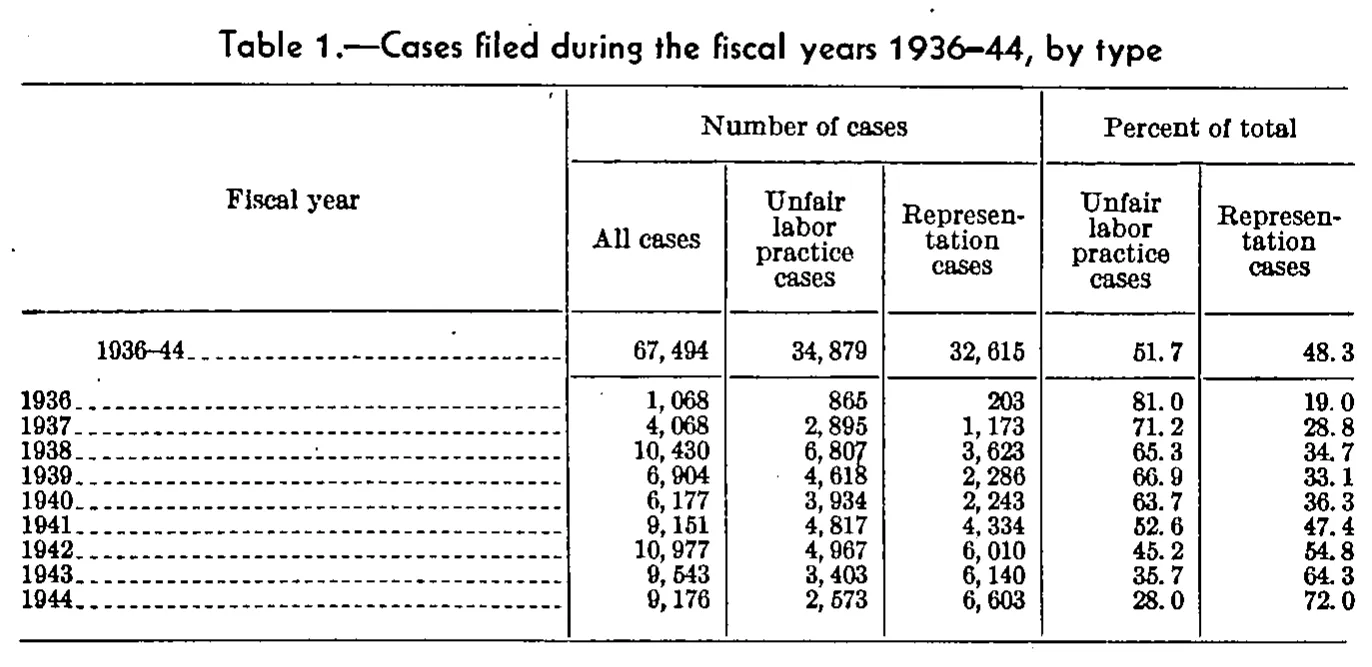
Cases filed during the fiscal years 1936-44, by type
| Fiscal year | Number of cases | Percent of total | |||
|---|---|---|---|---|---|
| Fiscal year | All cases | Unfair labor practice cases | Representation cases | Unfair labor practice cases | Representation cases |
| 1936–44 | 67,494 | 34,879 | 32,615 | 51.7 | 48.3 |
| 1936 | 1,068 | 865 | 203 | 81.0 | 19.0 |
| 1937 | 4,068 | 2,895 | 1,173 | 71.2 | 28.8 |
| 1938 | 10,430 | 6,807 | 3,623 | 65.3 | 34.7 |
| 1939 | 6,904 | 4,618 | 2,286 | 66.9 | 33.1 |
| 1940 | 6,177 | 3,934 | 2,243 | 63.7 | 36.3 |
| 1941 | 9,151 | 4,817 | 4,334 | 52.6 | 47.4 |
| 1942 | 10,977 | 4,967 | 6,010 | 45.2 | 54.8 |
| 1943 | 9,543 | 3,403 | 6,140 | 35.7 | 64.3 |
| 1944 | 9,176 | 2,573 | 6,603 | 28.0 | 72.0 |
30 of 30 figures sit in a row or column sum that works out.
Reader’s notes
p. 21. Six printed columns: the stub "Fiscal year" (a tall heading spanning both heading levels), three columns under the spanner "Number of cases" and two under "Percent of total". The first body row, set off by a rule, is the 1936–44 all-years total; its stub label is printed with an en dash, matching the caption. No footnotes are printed under the table. All values are internally consistent as transcribed: in every year the unfair labor practice and representation counts sum to the "All cases" figure, the yearly columns sum to the 1936–44 totals, and the percentages match the counts, so no misprint is suspected. The scan is clean; the only slightly soft glyph is the "51.7" in the 1936–44 row, but 34,879/67,494 = 51.7 percent confirms the reading.
Source image
Source data: U.S. NLRB Annual Reports (public domain). Reconstruction by NLRB Stats Archive. Read by claude-opus-5 (effort max, prompt extract_v1) from the 300-dpi scan; stitched by page. Updated October 2026.