NLRB Stats Archive › Annual Reports › FY1943 › Number of elections and pay-roll checks and number of valid votes cast during the fiscal year 1943, by industry
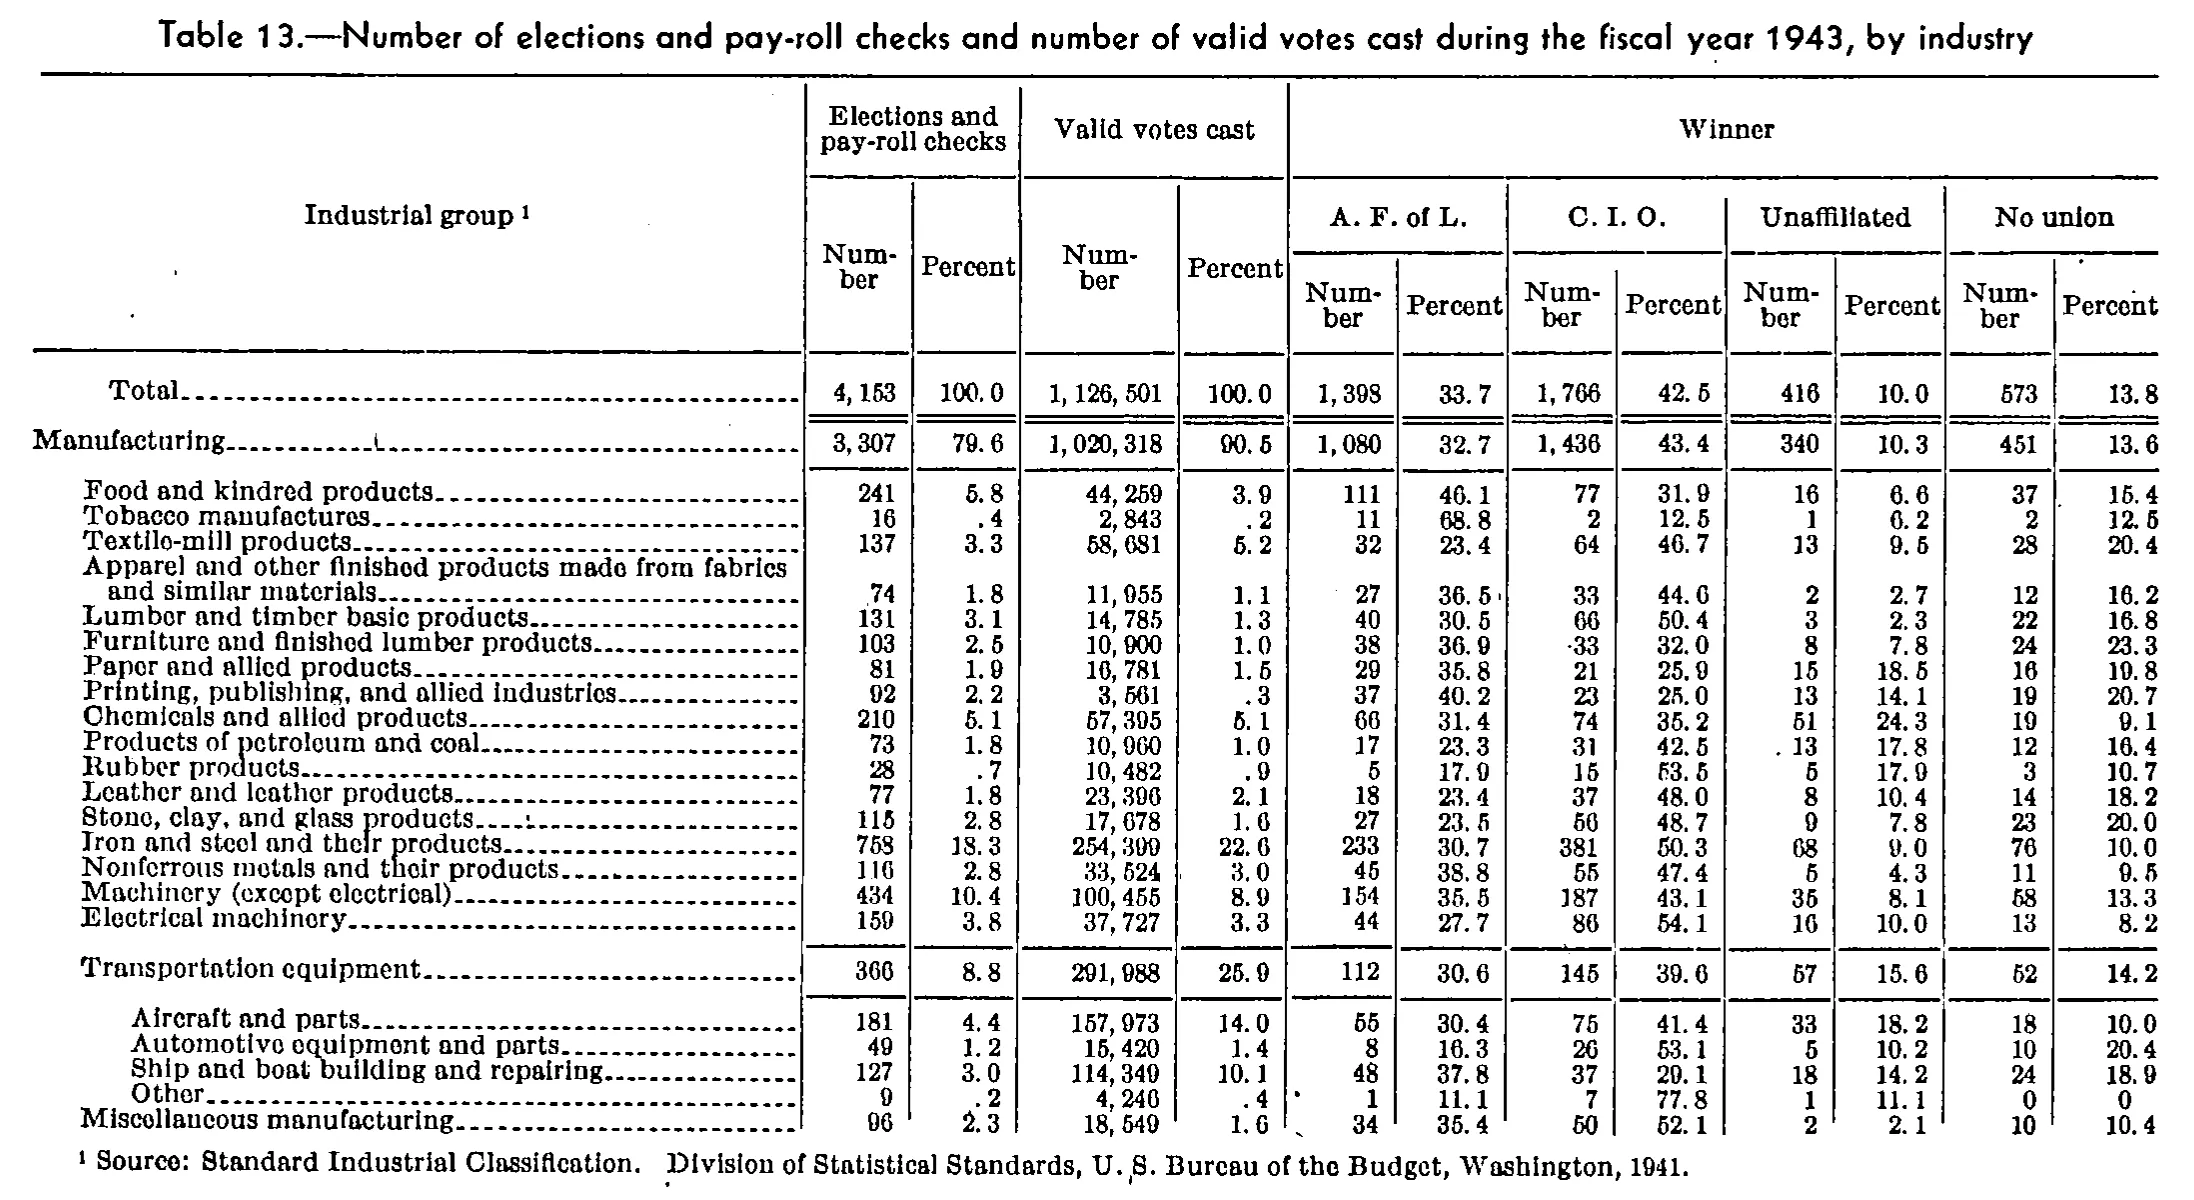
Number of elections and pay-roll checks and number of valid votes cast during the fiscal year 1943, by industry
Stitched from pp. 104–105.
| Industrial group | Elections and pay-roll checks | Valid votes cast | Winner | |||||||||
|---|---|---|---|---|---|---|---|---|---|---|---|---|
| Industrial group | Number | Percent | Number | Percent | A. F. of L. | C. I. O. | Unaffiliated | No union | ||||
| Industrial group | Number | Percent | Number | Percent | Number | Percent | Number | Percent | Number | Percent | Number | Percent |
| Total | 4,153 | 100.0 | 1,126,501 | 100.0 | 1,398 | 33.7 | 1,766 | 42.5 | 416 | 10.0 | 573 | 13.8 |
| Manufacturing | 3,307 | 79.6 | 1,020,318 | 90.5 | 1,080 | 32.7 | 1,436 | 43.4 | 340 | 10.3 | 451 | 13.6 |
| Food and kindred products | 241 | 5.8 | 44,259 | 3.9 | 111 | 46.1 | 77 | 31.9 | 16 | 6.6 | 37 | 15.4 |
| Tobacco manufactures | 16 | .4 | 2,843 | .2 | 11 | 68.8 | 2 | 12.5 | 1 | 6.2 | 2 | 12.5 |
| Textile-mill products | 137 | 3.3 | 58,681 | 5.2 | 32 | 23.4 | 64 | 46.7 | 13 | 9.5 | 28 | 20.4 |
| Apparel and other finished products made from fabrics and similar materials | 74 | 1.8 | 11,955 | 1.1 | 27 | 36.5 | 33 | 44.6 | 2 | 2.7 | 12 | 16.2 |
| Lumber and timber basic products | 131 | 3.1 | 14,785 | 1.3 | 40 | 30.5 | 66 | 50.4 | 3 | 2.3 | 22 | 16.8 |
| Furniture and finished lumber products | 103 | 2.5 | 10,900 | 1.0 | 38 | 36.9 | 33 | 32.0 | 8 | 7.8 | 24 | 23.3 |
| Paper and allied products | 81 | 1.9 | 16,781 | 1.5 | 29 | 35.8 | 21 | 25.9 | 15 | 18.5 | 16 | 19.8 |
| Printing, publishing, and allied industries | 92 | 2.2 | 3,561 | .3 | 37 | 40.2 | 23 | 25.0 | 13 | 14.1 | 19 | 20.7 |
| Chemicals and allied products | 210 | 5.1 | 57,395 | 5.1 | 66 | 31.4 | 74 | 35.2 | 51 | 24.3 | 19 | 9.1 |
| Products of petroleum and coal | 73 | 1.8 | 10,960 | 1.0 | 17 | 23.3 | 31 | 42.5 | 13 | 17.8 | 12 | 16.4 |
| Rubber products | 28 | .7 | 10,482 | .9 | 5 | 17.9 | 15 | 53.5 | 5 | 17.9 | 3 | 10.7 |
| Leather and leather products | 77 | 1.8 | 23,396 | 2.1 | 18 | 23.4 | 37 | 48.0 | 8 | 10.4 | 14 | 18.2 |
| Stone, clay, and glass products | 115 | 2.8 | 17,678 | 1.6 | 27 | 23.5 | 56 | 48.7 | 9 | 7.8 | 23 | 20.0 |
| Iron and steel and their products | 758 | 18.3 | 254,399 | 22.6 | 233 | 30.7 | 381 | 50.3 | 68 | 9.0 | 76 | 10.0 |
| Nonferrous metals and their products | 116 | 2.8 | 33,524 | 3.0 | 45 | 38.8 | 55 | 47.4 | 5 | 4.3 | 11 | 9.5 |
| Machinery (except electrical) | 434 | 10.4 | 100,455 | 8.9 | 154 | 35.5 | 187 | 43.1 | 35 | 8.1 | 58 | 13.3 |
| Electrical machinery | 159 | 3.8 | 37,727 | 3.3 | 44 | 27.7 | 86 | 54.1 | 16 | 10.0 | 13 | 8.2 |
| Transportation equipment | 366 | 8.8 | 291,988 | 25.9 | 112 | 30.6 | 145 | 39.6 | 57 | 15.6 | 52 | 14.2 |
| Aircraft and parts | 181 | 4.4 | 157,973 | 14.0 | 55 | 30.4 | 75 | 41.4 | 33 | 18.2 | 18 | 10.0 |
| Automotive equipment and parts | 49 | 1.2 | 15,420 | 1.4 | 8 | 16.3 | 26 | 53.1 | 5 | 10.2 | 10 | 20.4 |
| Ship and boat building and repairing | 127 | 3.0 | 114,349 | 10.1 | 48 | 37.8 | 37 | 29.1 | 18 | 14.2 | 24 | 18.9 |
| Other | 9 | .2 | 4,246 | .4 | 1 | 11.1 | 7 | 77.8 | 1 | 11.1 | 0 | 0 |
| Miscellaneous manufacturing | 96 | 2.3 | 18,549 | 1.6 | 34 | 35.4 | 50 | 52.1 | 2 | 2.1 | 10 | 10.4 |
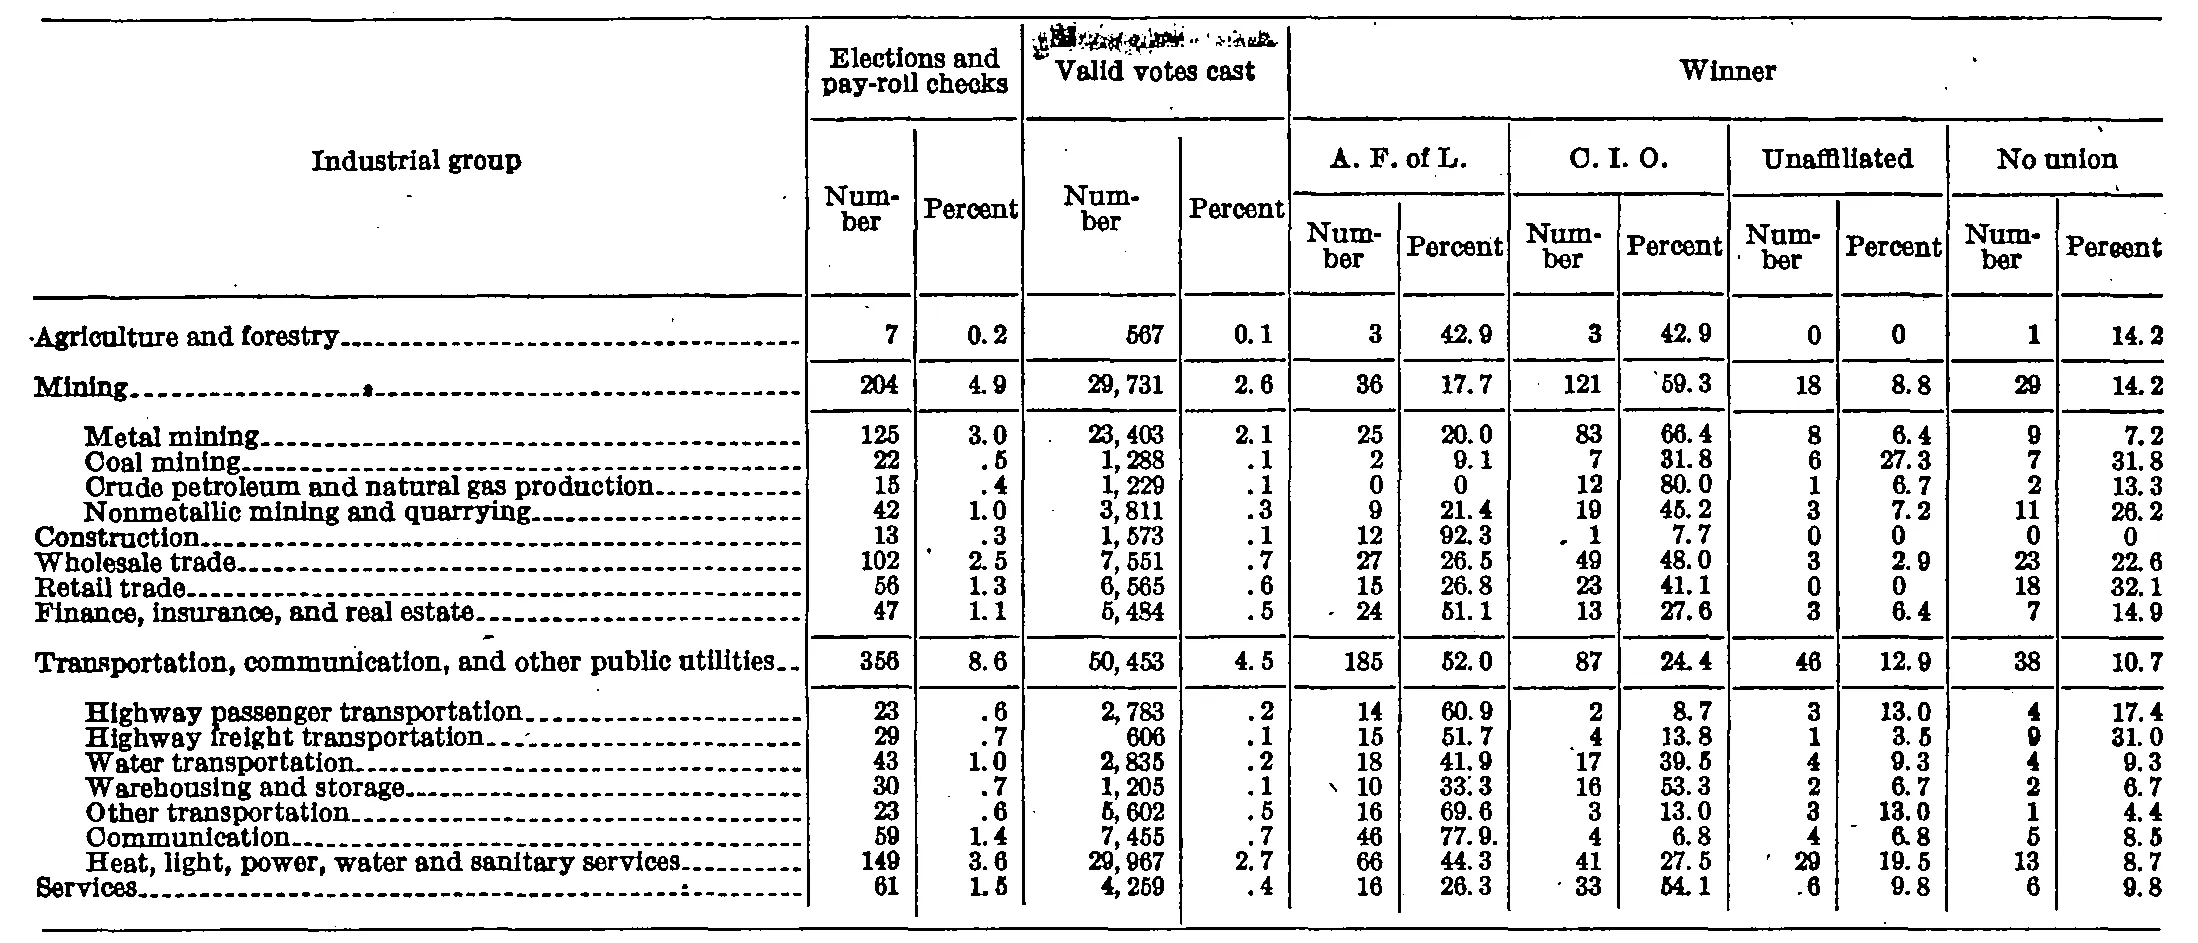
| Agriculture and forestry | 7 | 0.2 | 567 | 0.1 | 3 | 42.9 | 3 | 42.9 | 0 | 0 | 1 | 14.2 |
| Mining | 204 | 4.9 | 29,731 | 2.6 | 36 | 17.7 | 121 | 59.3 | 18 | 8.8 | 29 | 14.2 |
| Metal mining | 125 | 3.0 | 23,403 | 2.1 | 25 | 20.0 | 83 | 66.4 | 8 | 6.4 | 9 | 7.2 |
| Coal mining | 22 | .5 | 1,288 | .1 | 2 | 9.1 | 7 | 31.8 | 6 | 27.3 | 7 | 31.8 |
| Crude petroleum and natural gas production | 15 | .4 | 1,229 | .1 | 0 | 0 | 12 | 80.0 | 1 | 6.7 | 2 | 13.3 |
| Nonmetallic mining and quarrying | 42 | 1.0 | 3,811 | .3 | 9 | 21.4 | 19 | 45.2 | 3 | 7.2 | 11 | 26.2 |
| Construction | 13 | .3 | 1,573 | .1 | 12 | 92.3 | 1 | 7.7 | 0 | 0 | 0 | 0 |
| Wholesale trade | 102 | 2.5 | 7,551 | .7 | 27 | 26.5 | 49 | 48.0 | 3 | 2.9 | 23 | 22.6 |
| Retail trade | 56 | 1.3 | 6,565 | .6 | 15 | 26.8 | 23 | 41.1 | 0 | 0 | 18 | 32.1 |
| Finance, insurance, and real estate | 47 | 1.1 | 5,484 | .5 | 24 | 51.1 | 13 | 27.6 | 3 | 6.4 | 7 | 14.9 |
| Transportation, communication, and other public utilities | 356 | 8.6 | 50,453 | 4.5 | 185 | 52.0 | 87 | 24.4 | 46 | 12.9 | 38 | 10.7 |
| Highway passenger transportation | 23 | .6 | 2,783 | .2 | 14 | 60.9 | 2 | 8.7 | 3 | 13.0 | 4 | 17.4 |
| Highway freight transportation | 29 | .7 | 606 | .1 | 15 | 51.7 | 4 | 13.8 | 1 | 3.5 | 9 | 31.0 |
| Water transportation | 43 | 1.0 | 2,835 | .2 | 18 | 41.9 | 17 | 39.5 | 4 | 9.3 | 4 | 9.3 |
| Warehousing and storage | 30 | .7 | 1,205 | .1 | 10 | 33.3 | 16 | 53.3 | 2 | 6.7 | 2 | 6.7 |
| Other transportation | 23 | .6 | 5,602 | .5 | 16 | 69.6 | 3 | 13.0 | 3 | 13.0 | 1 | 4.4 |
| Communication | 59 | 1.4 | 7,455 | .7 | 46 | 77.9 | 4 | 6.8 | 4 | 6.8 | 5 | 8.5 |
| Heat, light, power, water and sanitary services | 149 | 3.6 | 29,967 | 2.7 | 66 | 44.3 | 41 | 27.5 | 29 | 19.5 | 13 | 8.7 |
| Services | 61 | 1.5 | 4,259 | .4 | 16 | 26.3 | 33 | 54.1 | 6 | 9.8 | 6 | 9.8 |
- 1 Source: Standard Industrial Classification. Division of Statistical Standards, U. S. Bureau of the Budget, Washington, 1941.
258 of 258 figures sit in a row or column sum that works out.
Reader’s notes
p. 104. 13 columns: stub, Elections and pay-roll checks (Number, Percent), Valid votes cast (Number, Percent), and Winner split into four two-column pairs (A. F. of L., C. I. O., Unaffiliated, No union). The page ends after "Miscellaneous manufacturing", so the table is incomplete here: the "Total" line (4,153 elections) exceeds the "Manufacturing" line (3,307), and the nonmanufacturing industry groups that make up the difference must continue on the following page. No "Continued" line is printed on this crop. All count columns were cross-checked and are internally consistent: in every row the four Winner numbers sum to the "Elections and pay-roll checks" number, and the manufacturing detail lines (including the Transportation equipment subtotal and Miscellaneous manufacturing) sum exactly to 3,307 elections and 1,020,318 valid votes. Confidence in the count columns is accordingly high. The percent columns are the faint ones in this scan, and the report mixes rounding with truncation (e.g. Rubber products C. I. O. 53.5 and Machinery (except electrical) No union 13.3 are truncated, while Tobacco manufactures A. F. of L. 68.8 is rounded), so arithmetic cannot settle every doubtful digit. Two percent cells are read with lower confidence and are transcribed exactly as they appear: "Chemicals and allied products" / No union Percent, read as 9.1 (19 of 210 implies 9.0); and "Aircraft and parts" / No union Percent, read as 10.0 (18 of 181 implies 9.9). Either could be a misprint or a misread of a worn digit. Minor marks that were not transcribed: a stray ink dot before the C. I. O. number 33 in "Furniture and finished lumber products", before the Unaffiliated number 13 in "Products of petroleum and coal", and before the A. F. of L. number 1 in "Other"; these are printing speckle, not footnote markers. In the "Other" row the No union columns print a bare "0" for both the number and the percent.
p. 105. The crop is a continuation page: no caption and no footnotes are printed, and the body starts directly with "Agriculture and forestry" (the table's earlier rows, including any total line, are on the preceding page). The body is ruled off at the bottom after "Services", but the industrial-group series plainly continues beyond this crop (manufacturing groups, etc. are absent), so rows before and after this block exist elsewhere. Column structure: 13 columns — stub, then Number/Percent under "Elections and pay-roll checks", Number/Percent under "Valid votes cast", and four Number/Percent pairs under the spanner "Winner" (A. F. of L., C. I. O., Unaffiliated, No union). Scan-quality items, all transcribed as the intended printed text: the heading of the last column images as "Pereent" (broken "c"); it is "Percent", matching the other seven. A dark ink smudge/offset blot sits over the "Valid votes cast" spanner heading but the words are legible. In "Warehousing and storage", the A. F. of L. percent images as "33:3" and is read as 33.3; in "Communication", the A. F. of L. percent images as "77. 9." with a stray trailing dot and is read as 77.9. Stray specks also sit left of "24" (Finance, A. F. of L. Number), left of "10" (Warehousing, A. F. of L. Number), left of "1" (Construction, C. I. O. Number), left of "121" (Mining, C. I. O. Percent "59.3" leading tick) and left of "29"/".6" in the last two body rows; these are print noise, not footnote markers or digits. Decimal fractions under 1 are printed without a leading zero (".5", ".1", ".3") except in the first body row, where "0.2" and "0.1" are printed with the zero; both forms are transcribed as printed. Zeros are printed as "0" in both Number and Percent cells and are kept. Indentation (not representable in the grid): "Metal mining", "Coal mining", "Crude petroleum and natural gas production" and "Nonmetallic mining and quarrying" are indented subgroups of "Mining"; "Highway passenger transportation" through "Heat, light, power, water and sanitary services" are indented subgroups of "Transportation, communication, and other public utilities". "Construction", "Wholesale trade", "Retail trade", "Finance, insurance, and real estate" and "Services" are flush-left major groups despite sitting inside the same ruled blocks. Nothing was computed or corrected; percentages that do not sum exactly (e.g. Agriculture and forestry: 42.9 + 42.9 + 0 + 14.2 = 100.0, but Mining: 17.7 + 59.3 + 8.8 + 14.2 = 100.0 while Coal mining gives 9.1 + 31.8 + 27.3 + 31.8 = 100.0) are left as printed.
Source image
Source data: U.S. NLRB Annual Reports (public domain). Reconstruction by NLRB Stats Archive. Read by claude-opus-5 (effort max, prompt extract_v1) from the 300-dpi scan; stitched by page. Updated October 2026.