NLRB Stats Archive › Annual Reports › FY1943 › Disposition of representation cases — by method and stage
Disposition of representation cases — by method and stage
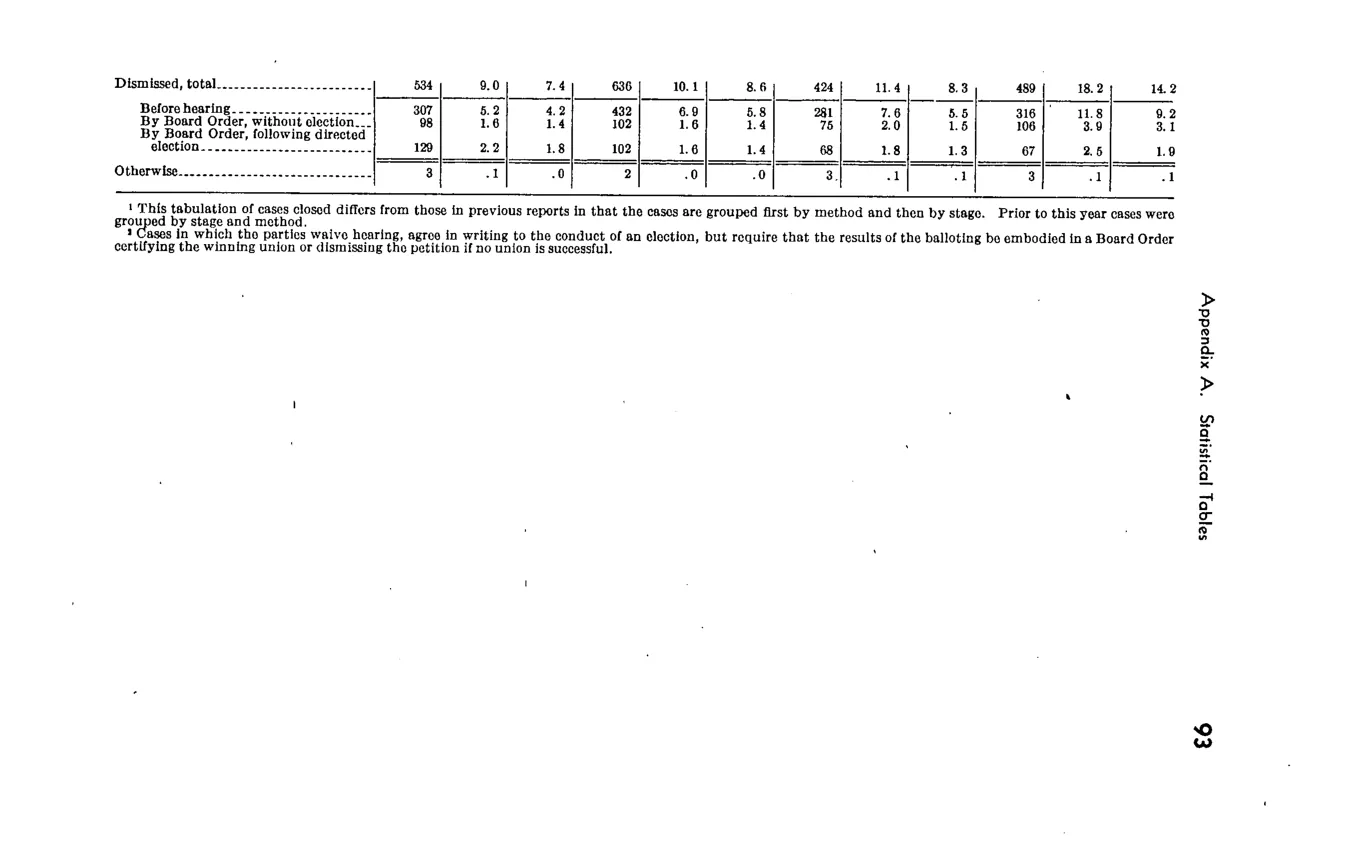
| Method and stage of disposition | Fiscal year 1943 | Fiscal year 1943 | Fiscal year 1943 | Fiscal year 1942 | Fiscal year 1942 | Fiscal year 1942 | Fiscal year 1941 | Fiscal year 1941 | Fiscal year 1941 | Fiscal year 1940 | Fiscal year 1940 | Fiscal year 1940 |
|---|---|---|---|---|---|---|---|---|---|---|---|---|
| Method and stage of disposition | Number of cases | Percent of cases closed | Percent of cases on docket | Number of cases | Percent of cases closed | Percent of cases on docket | Number of cases | Percent of cases closed | Percent of cases on docket | Number of cases | Percent of cases closed | Percent of cases on docket |
| Dismissed, total | 534 | 9 | 7.4 | 636 | 10.1 | 8.6 | 424 | 11.4 | 8.3 | 489 | 18.2 | 14.2 |
| Before hearing | 307 | 5.2 | 4.2 | 432 | 6.9 | 5.8 | 281 | 7.6 | 5.5 | 316 | 11.8 | 9.2 |
| By Board Order, without election | 98 | 1.6 | 1.4 | 102 | 1.6 | 1.4 | 75 | 2 | 1.5 | 106 | 3.9 | 3.1 |
| By Board Order, following directed election | 129 | 2.2 | 1.8 | 102 | 1.6 | 1.4 | 68 | 1.8 | 1.3 | 67 | 2.5 | 1.9 |
| Otherwise | 3 | 0.1 | 0 | 2 | 0 | 0 | 3 | 0.1 | 0.1 | 3 | 0.1 | 0.1 |
Source image
Source data: U.S. NLRB Annual Reports (public domain). Reconstruction by NLRB Stats Archive. Updated June 2026.