NLRB Stats Archive › Annual Reports › FY1943 › Percent distribution of representation cases received during the fiscal year 1943, by industry, by size of unit
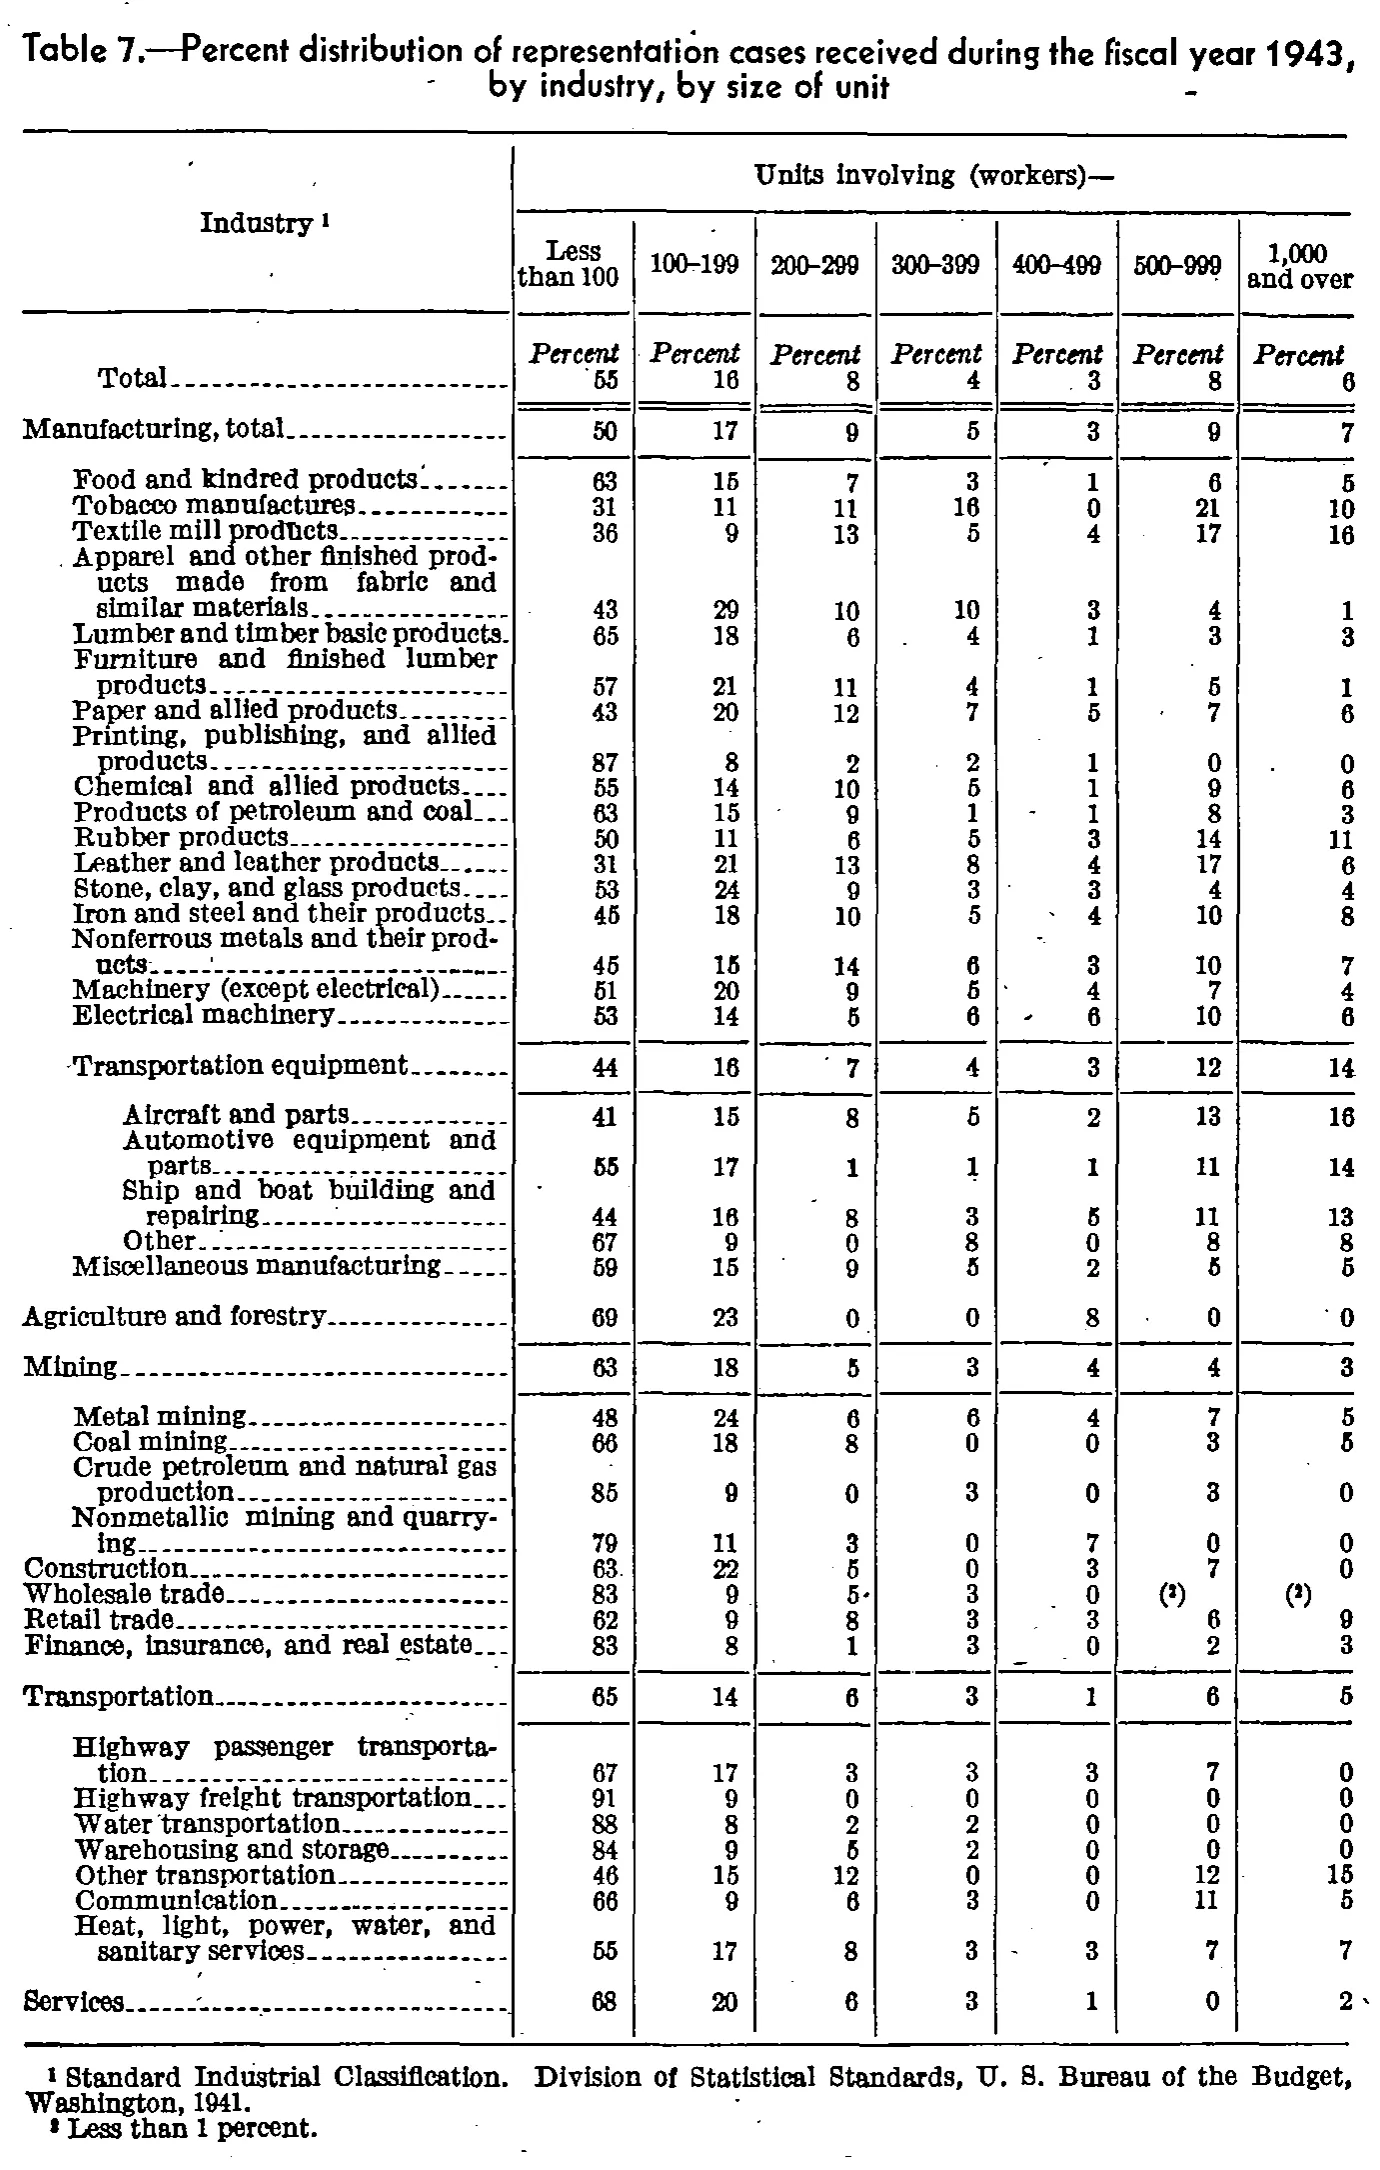
Percent distribution of representation cases received during the fiscal year 1943, by industry, by size of unit
| Industry | Units involving (workers)— | ||||||
|---|---|---|---|---|---|---|---|
| Industry | Less than 100 | 100-199 | 200-299 | 300-399 | 400-499 | 500-999 | 1,000 and over |
| Percent | Percent | Percent | Percent | Percent | Percent | Percent | |
| Total | 55 | 16 | 8 | 4 | 3 | 8 | 6 |
| Manufacturing, total | 50 | 17 | 9 | 5 | 3 | 9 | 7 |
| Food and kindred products | 63 | 15 | 7 | 3 | 1 | 6 | 5 |
| Tobacco manufactures | 31 | 11 | 11 | 16 | 0 | 21 | 10 |
| Textile mill products | 36 | 9 | 13 | 5 | 4 | 17 | 16 |
| Apparel and other finished products made from fabric and similar materials | 43 | 29 | 10 | 10 | 3 | 4 | 1 |
| Lumber and timber basic products | 65 | 18 | 6 | 4 | 1 | 3 | 3 |
| Furniture and finished lumber products | 57 | 21 | 11 | 4 | 1 | 5 | 1 |
| Paper and allied products | 43 | 20 | 12 | 7 | 5 | 7 | 6 |
| Printing, publishing, and allied products | 87 | 8 | 2 | 2 | 1 | 0 | 0 |
| Chemical and allied products | 55 | 14 | 10 | 5 | 1 | 9 | 6 |
| Products of petroleum and coal | 63 | 15 | 9 | 1 | 1 | 8 | 3 |
| Rubber products | 50 | 11 | 6 | 5 | 3 | 14 | 11 |
| Leather and leather products | 31 | 21 | 13 | 8 | 4 | 17 | 6 |
| Stone, clay, and glass products | 53 | 24 | 9 | 3 | 3 | 4 | 4 |
| Iron and steel and their products | 45 | 18 | 10 | 5 | 4 | 10 | 8 |
| Nonferrous metals and their products | 45 | 15 | 14 | 6 | 3 | 10 | 7 |
| Machinery (except electrical) | 51 | 20 | 9 | 5 | 4 | 7 | 4 |
| Electrical machinery | 53 | 14 | 5 | 6 | 6 | 10 | 6 |
| Transportation equipment | 44 | 16 | 7 | 4 | 3 | 12 | 14 |
| Aircraft and parts | 41 | 15 | 8 | 5 | 2 | 13 | 16 |
| Automotive equipment and parts | 55 | 17 | 1 | 1 | 1 | 11 | 14 |
| Ship and boat building and repairing | 44 | 16 | 8 | 3 | 5 | 11 | 13 |
| Other | 67 | 9 | 0 | 8 | 0 | 8 | 8 |
| Miscellaneous manufacturing | 59 | 15 | 9 | 5 | 2 | 5 | 5 |
| Agriculture and forestry | 69 | 23 | 0 | 0 | 8 | 0 | 0 |
| Mining | 63 | 18 | 5 | 3 | 4 | 4 | 3 |
| Metal mining | 48 | 24 | 6 | 6 | 4 | 7 | 5 |
| Coal mining | 66 | 18 | 8 | 0 | 0 | 3 | 5 |
| Crude petroleum and natural gas production | 85 | 9 | 0 | 3 | 0 | 3 | 0 |
| Nonmetallic mining and quarrying | 79 | 11 | 3 | 0 | 7 | 0 | 0 |
| Construction | 63 | 22 | 5 | 0 | 3 | 7 | 0 |
| Wholesale trade | 83 | 9 | 5 | 3 | 0 | [2] | [2] |
| Retail trade | 62 | 9 | 8 | 3 | 3 | 6 | 9 |
| Finance, insurance, and real estate | 83 | 8 | 1 | 3 | 0 | 2 | 3 |
| Transportation | 65 | 14 | 6 | 3 | 1 | 6 | 5 |
| Highway passenger transportation | 67 | 17 | 3 | 3 | 3 | 7 | 0 |
| Highway freight transportation | 91 | 9 | 0 | 0 | 0 | 0 | 0 |
| Water transportation | 88 | 8 | 2 | 2 | 0 | 0 | 0 |
| Warehousing and storage | 84 | 9 | 5 | 2 | 0 | 0 | 0 |
| Other transportation | 46 | 15 | 12 | 0 | 0 | 12 | 15 |
| Communication | 66 | 9 | 6 | 3 | 0 | 11 | 5 |
| Heat, light, power, water, and sanitary services | 55 | 17 | 8 | 3 | 3 | 7 | 7 |
| Services | 68 | 20 | 6 | 3 | 1 | 0 | 2 |
- 1 Standard Industrial Classification. Division of Statistical Standards, U. S. Bureau of the Budget, Washington, 1941.
- 2 Less than 1 percent.
0 of 269 figures sit in a row or column sum that works out.
Reader’s notes
p. 97. The italic "Percent" unit line is printed below the rule that closes the column headings and above the Total row, and it carries no stub label; it is transcribed as the first body row with an empty stub cell rather than as a third heading level. In the "Wholesale trade" row the 500-999 and 1,000 and over cells hold a parenthesised superscript footnote reference in place of a figure (footnote 2, "Less than 1 percent"); both are transcribed as "(2)". Every data row's seven percentages sum to exactly 100 (the Wholesale trade row sums to 100 across its five numeric cells, with the two "(2)" cells under 1 percent each), which corroborates the digit readings; no printed value appears to be a misprint. The stub labels for Manufacturing, Transportation equipment, Mining and Transportation are set flush left as section/group lines, while their component industries are indented; indentation is not preserved in the grid. "Other" (indented under Transportation equipment) is the printed label for the residual transportation-equipment class.
Source image
Source data: U.S. NLRB Annual Reports (public domain). Reconstruction by NLRB Stats Archive. Read by claude-opus-5 (effort max, prompt extract_v1) from the 300-dpi scan; stitched by page. Updated October 2026.