NLRB Stats Archive › Annual Reports › FY1943 › Percent distribution of representation cases received — by size of unit
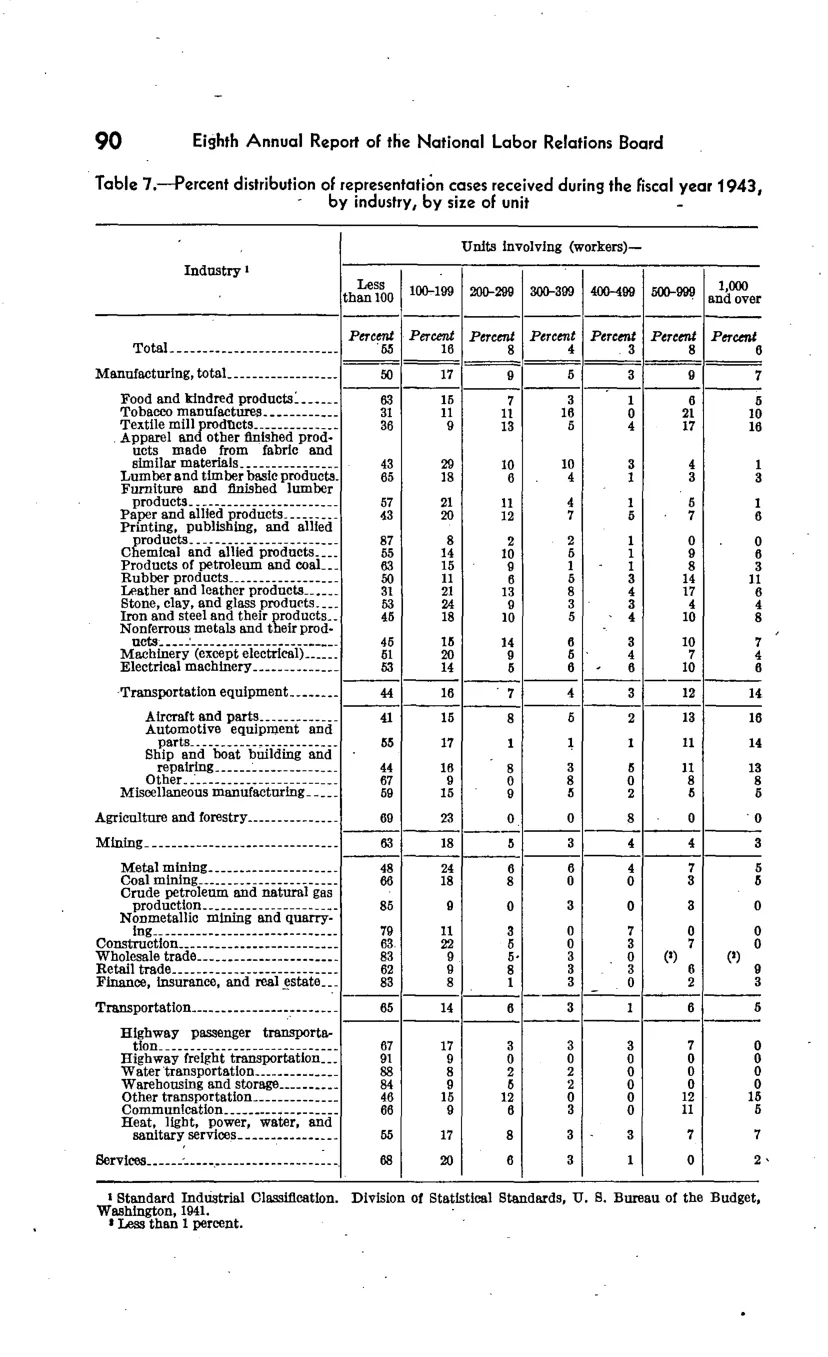
Percent distribution of representation cases received — by size of unit
| Industry | Units involving (workers)— | Units involving (workers)— | Units involving (workers)— | Units involving (workers)— | Units involving (workers)— | Units involving (workers)— | Units involving (workers)— |
|---|---|---|---|---|---|---|---|
| Industry | Less than 100 | 100-199 | 200-299 | 300-399 | 400-499 | 500-999 | 1,000 and over |
| Total | 55 | 16 | 9 | 5 | 3 | 6 | 6 |
| Manufacturing, total | 50 | 17 | 9 | 5 | 3 | 9 | 7 |
| Transportation equipment | 44 | 16 | 7 | 4 | 3 | 12 | 14 |
| Agriculture and forestry | 69 | 23 | 0 | 0 | 8 | 0 | 0 |
| Mining | 63 | 18 | 5 | 3 | 3 | 4 | 3 |
| Construction | 79 | 11 | 3 | 0 | 0 | 7 | 0 |
| Wholesale trade | 83 | 9 | 5 | 3 | 0 | 0 | 0 |
| Retail trade | 82 | 9 | 5 | 3 | 0 | ||
| Finance, insurance, and real estate | 85 | 8 | 1 | 3 | 0 | 6 | 3 |
| Transportation | 65 | 14 | 6 | 3 | 1 | 6 | 5 |
| Services | 68 | 20 |
Source image
Source data: U.S. NLRB Annual Reports (public domain). Reconstruction by NLRB Stats Archive. Updated June 2026.