NLRB Stats Archive › Annual Reports › FY1943 › Distribution of cases received and percent increase or decrease
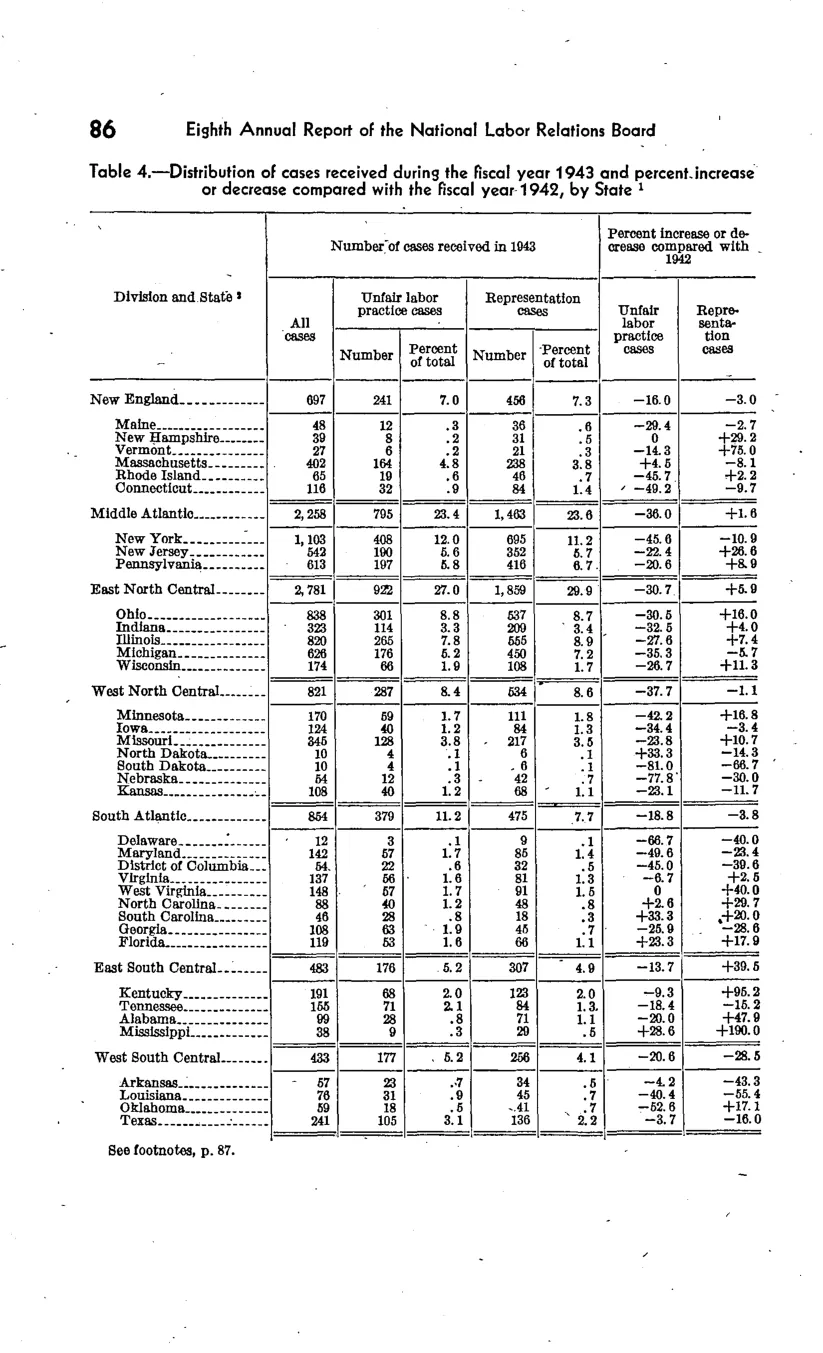
Distribution of cases received and percent increase or decrease
| Division and State | Number of cases received in 1943 | Number of cases received in 1943 | Number of cases received in 1943 | Number of cases received in 1943 | Number of cases received in 1943 | Percent increase or decrease compared with 1942 | Percent increase or decrease compared with 1942 |
|---|---|---|---|---|---|---|---|
| Division and State | All cases | Unfair labor practice cases | Unfair labor practice cases | Representation cases | Representation cases | Unfair labor practice cases | Representation cases |
| Division and State | All cases | Number | Percent of total | Number | Percent of total | Unfair labor practice cases | Representation cases |
| New England | 697 | 241 | 7 | 456 | 7.3 | -16 | -3 |
| Middle Atlantic | 2,258 | 795 | 23.4 | 1,463 | 23.4 | -36 | +1.6 |
| East North Central | 2,781 | 922 | 27 | 1,859 | 29.9 | -30.7 | +5.9 |
| West North Central | 821 | 287 | 8.4 | 534 | 8.6 | -37.7 | -1.1 |
| South Atlantic | 854 | 379 | 11.2 | 475 | 7.7 | -18.8 | -3.8 |
| East South Central | 483 | 176 | 5.2 | 307 | 4.9 | -13.7 | +39.5 |
| West South Central | 433 | 177 | 5.2 | 256 | 4.1 | -20.6 | -28.5 |
Source image
Source data: U.S. NLRB Annual Reports (public domain). Reconstruction by NLRB Stats Archive. Updated June 2026.