NLRB Stats Archive › Annual Reports › FY1943 › Distribution of cases and workers involved in cases received
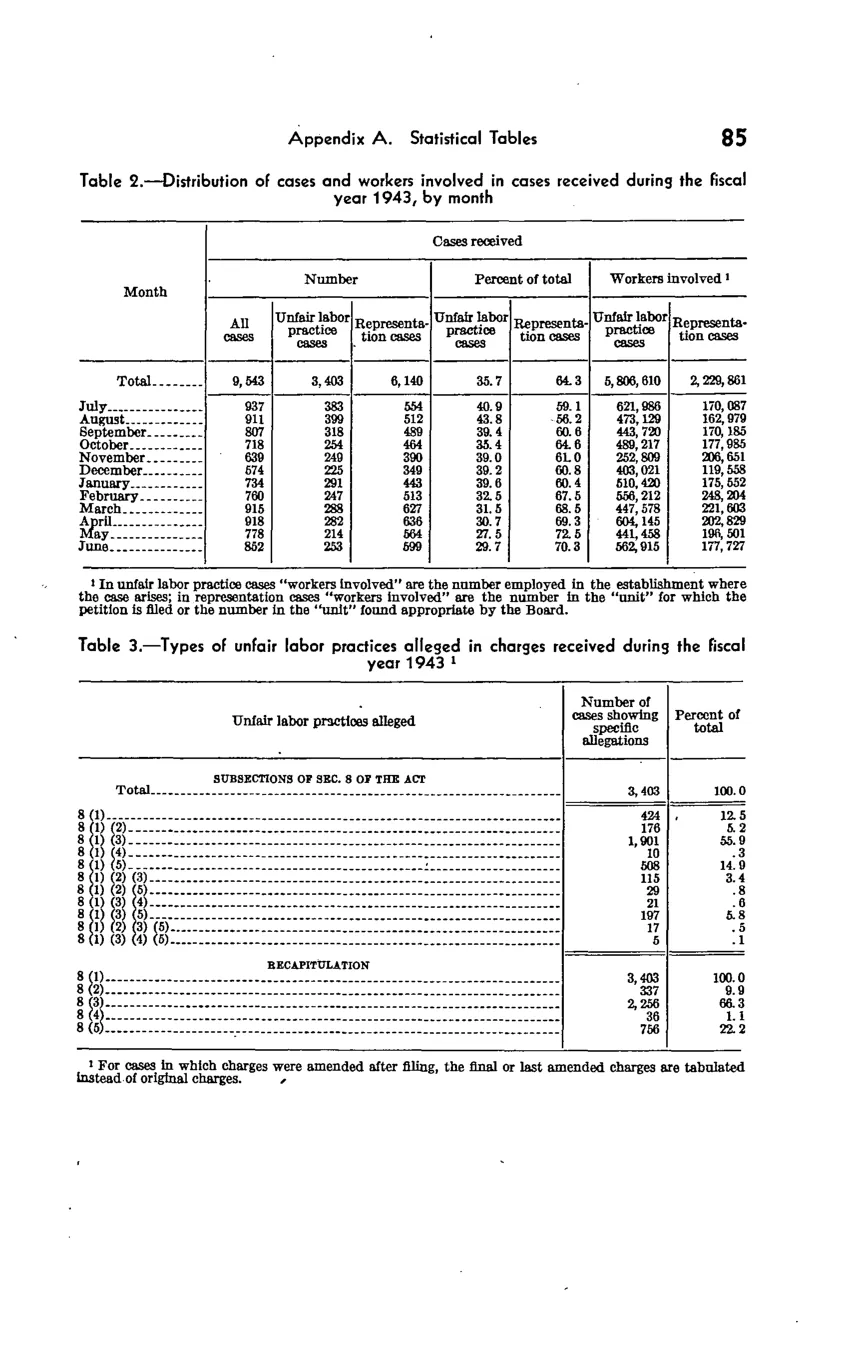
Distribution of cases and workers involved in cases received
| Month | Cases received | Cases received | Cases received | Cases received | Cases received | Cases received | Cases received |
|---|---|---|---|---|---|---|---|
| Month | Number | Number | Number | Percent of total | Percent of total | Workers involved | Workers involved |
| Month | All cases | Unfair labor practice cases | Representation cases | Unfair labor practice cases | Representation cases | Unfair labor practice cases | Representation cases |
| Total | 9,543 | 3,403 | 6,140 | 35.7 | 64.3 | 5,806,610 | 2,229,861 |
| July | 937 | 383 | 554 | 40.9 | 59.1 | 621,986 | 170,087 |
| August | 911 | 399 | 512 | 43.8 | 56.2 | 473,129 | 162,979 |
| September | 807 | 318 | 489 | 39.4 | 60.6 | 443,720 | 170,185 |
| October | 718 | 254 | 464 | 35.4 | 64.6 | 489,217 | 177,985 |
| November | 639 | 249 | 390 | 39 | 61 | 252,809 | 206,651 |
| December | 574 | 225 | 349 | 39.2 | 60.8 | 403,021 | 119,558 |
| January | 734 | 291 | 443 | 39.6 | 60.4 | 510,420 | 175,552 |
| February | 760 | 247 | 513 | 32.5 | 67.5 | 556,212 | 245,204 |
| March | 915 | 288 | 627 | 31.5 | 68.5 | 447,578 | 221,603 |
| April | 918 | 282 | 636 | 30.7 | 69.3 | 604,145 | 202,829 |
| May | 778 | 214 | 564 | 27.5 | 72.5 | 441,458 | 196,501 |
| June | 852 | 253 | 599 | 29.7 | 70.3 | 562,915 | 177,727 |
Source image
Source data: U.S. NLRB Annual Reports (public domain). Reconstruction by NLRB Stats Archive. Updated June 2026.