NLRB Stats Archive › Annual Reports › FY1943 › Geographic distribution of cases received during the fiscal year 1943, and percent increase or decrease compared with the fiscal year 1942
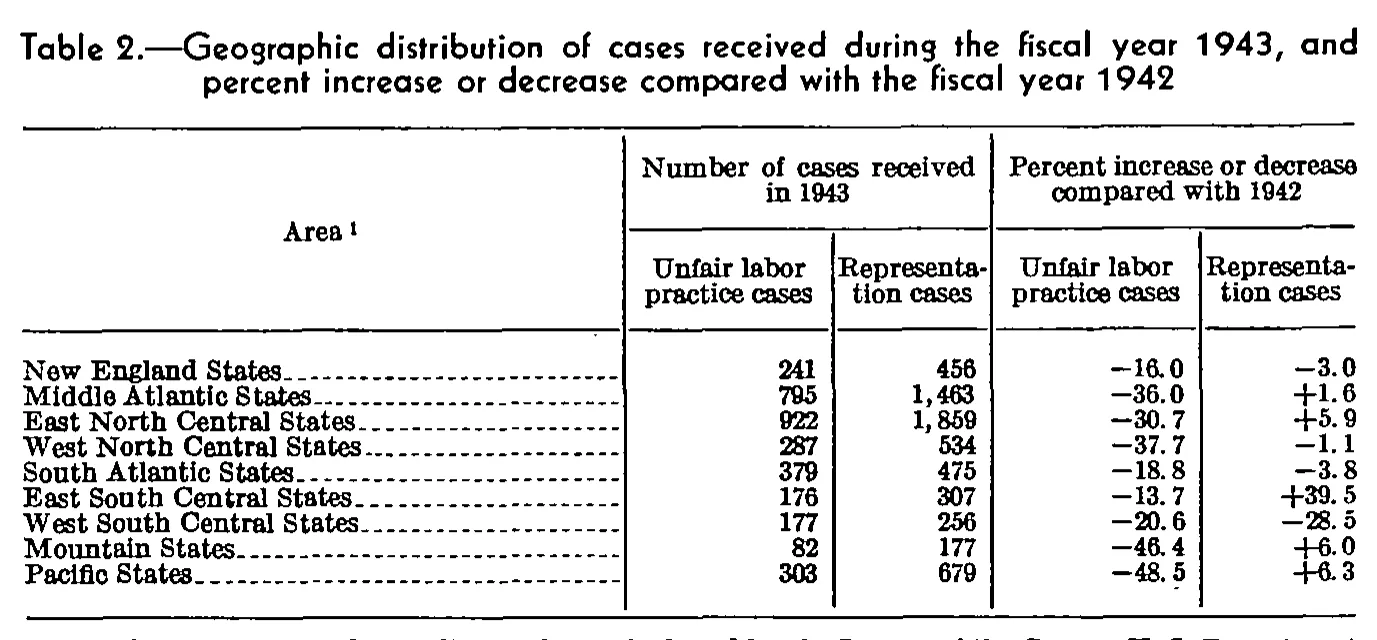
Geographic distribution of cases received during the fiscal year 1943, and percent increase or decrease compared with the fiscal year 1942
| Area | Number of cases received in 1943 | Percent increase or decrease compared with 1942 | ||
|---|---|---|---|---|
| Area | Unfair labor practice cases | Representation cases | Unfair labor practice cases | Representation cases |
| New England States | 241 | 456 | -16.0 | -3.0 |
| Middle Atlantic States | 795 | 1,463 | -36.0 | +1.6 |
| East North Central States | 922 | 1,859 | -30.7 | +5.9 |
| West North Central States | 287 | 534 | -37.7 | -1.1 |
| South Atlantic States | 379 | 475 | -18.8 | -3.8 |
| East South Central States | 176 | 307 | -13.7 | +39.5 |
| West South Central States | 177 | 256 | -20.6 | -28.5 |
| Mountain States | 82 | 177 | -46.4 | +6.0 |
| Pacific States | 303 | 679 | -48.5 | +6.3 |
0 of 18 figures sit in a row or column sum that works out.
Reader’s notes
p. 26. The crop is cut off at the bottom: below the closing rule only the upper few pixels of one line of text are visible, almost certainly the text of footnote 1 attached to the stub heading "Area 1" (it appears to begin with something like "The areas ... correspond to those used by the United States Bureau of the ..."). It is not legible enough to transcribe, so `footnotes` is left empty even though a footnote marker is present in the heading. No total row is printed; the nine regional rows are the whole body. The percent columns are typeset with a space after the decimal point ("-16. 0", "+39. 5"); the spaces have been closed up. Minus signs are printed as a short dash and are transcribed as "-"; plus signs as printed.
Source image
Source data: U.S. NLRB Annual Reports (public domain). Reconstruction by NLRB Stats Archive. Read by claude-opus-5 (effort max, prompt extract_v1) from the 300-dpi scan; stitched by page. Updated October 2026.